Knowledge base in drone services
Bonitification, stand classification - an indicator that determines the productive capacity of a forest habitat for a given species. The bonitation class is determined by the age and height of the stand.


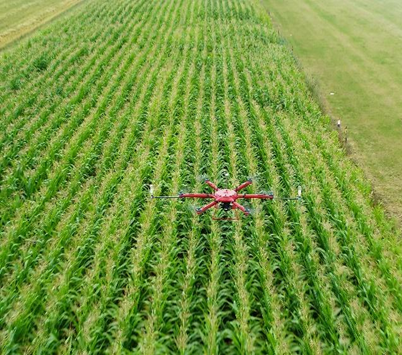
BSL - short for: UAV. Otherwise known as an unmanned aircraft or drone.
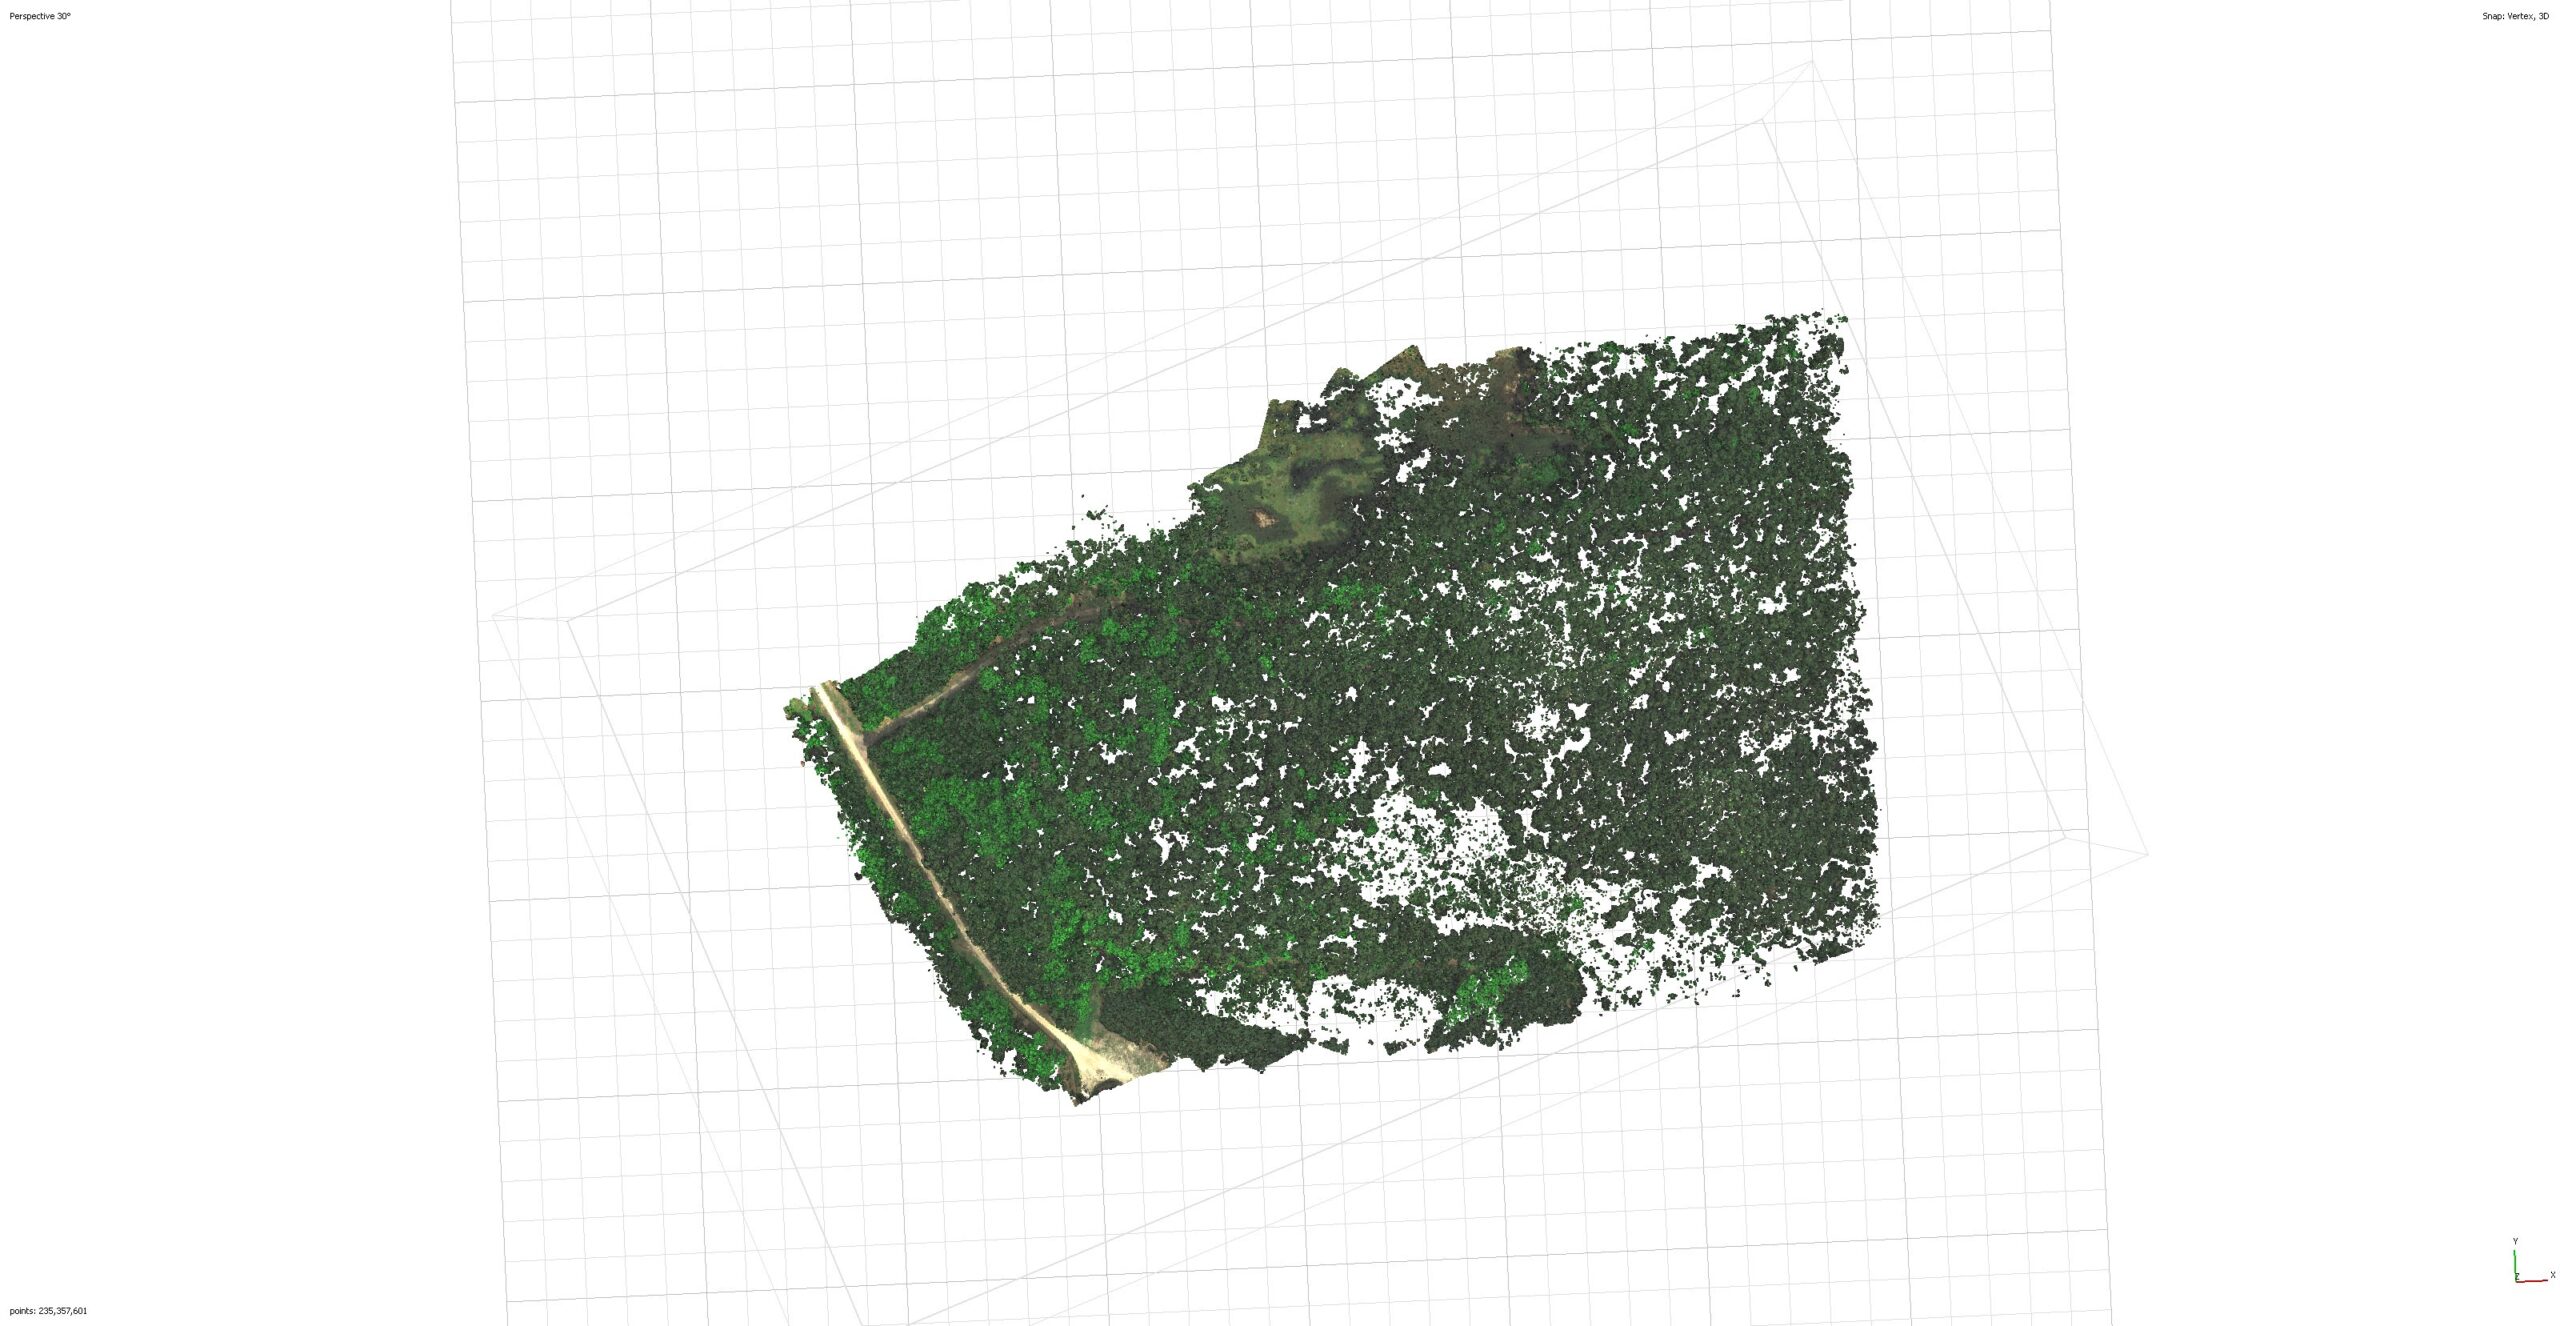
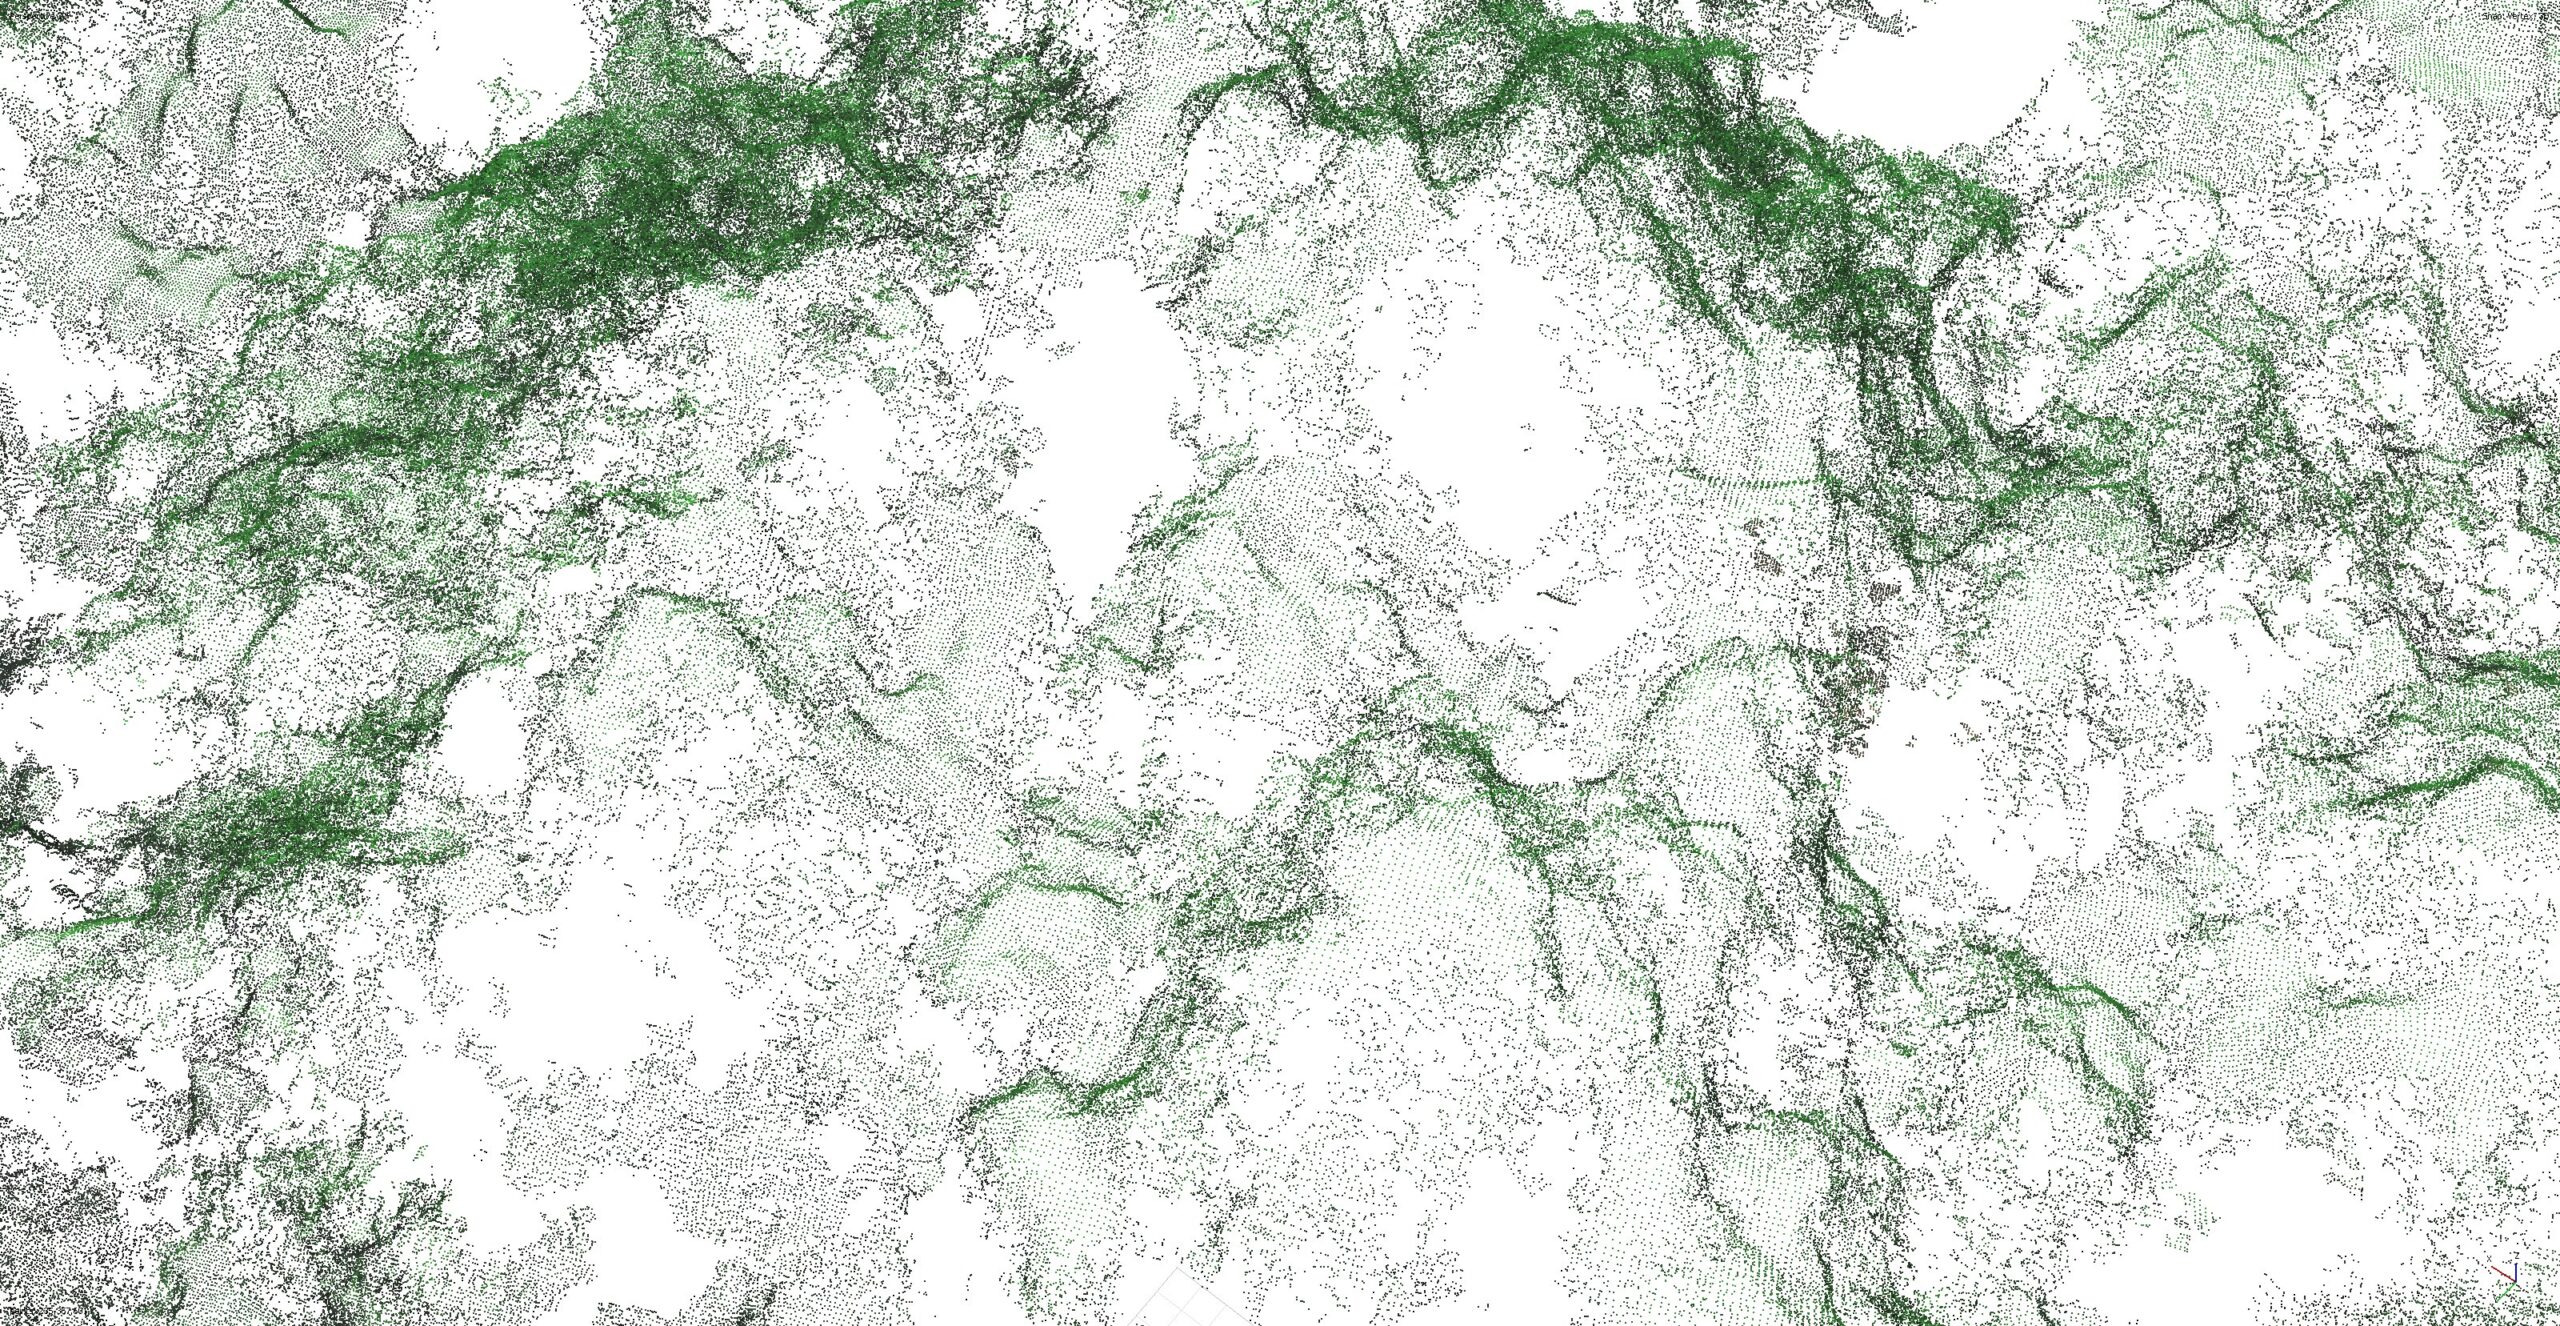
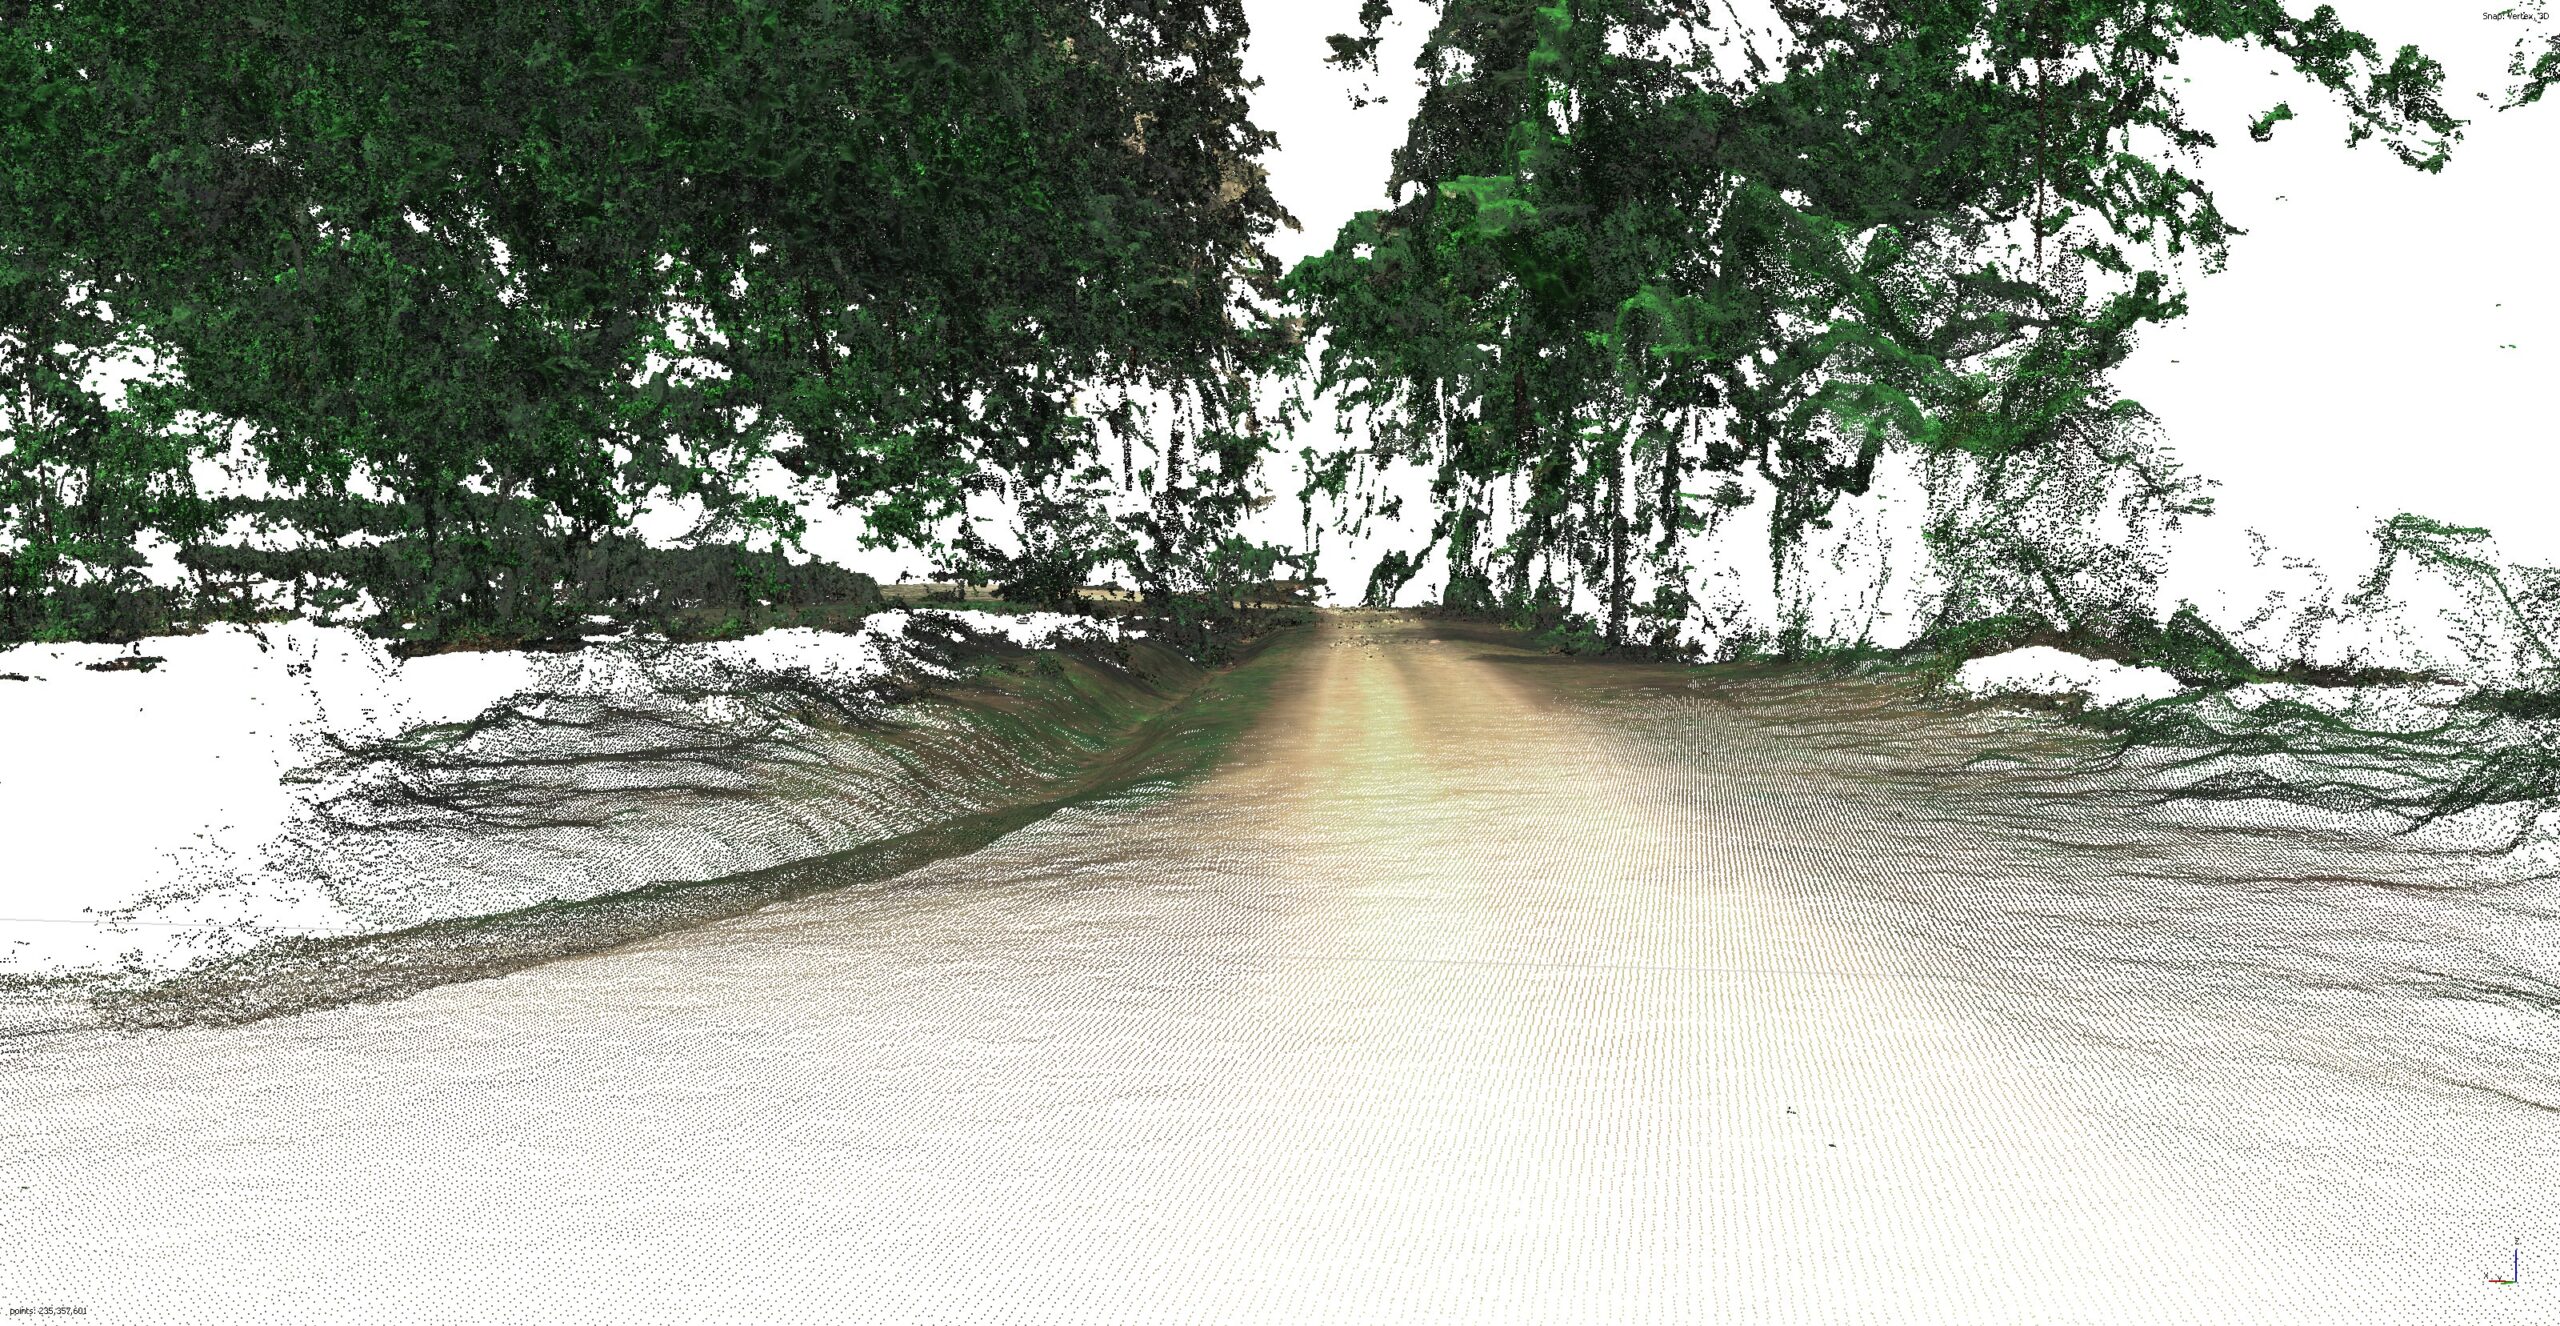
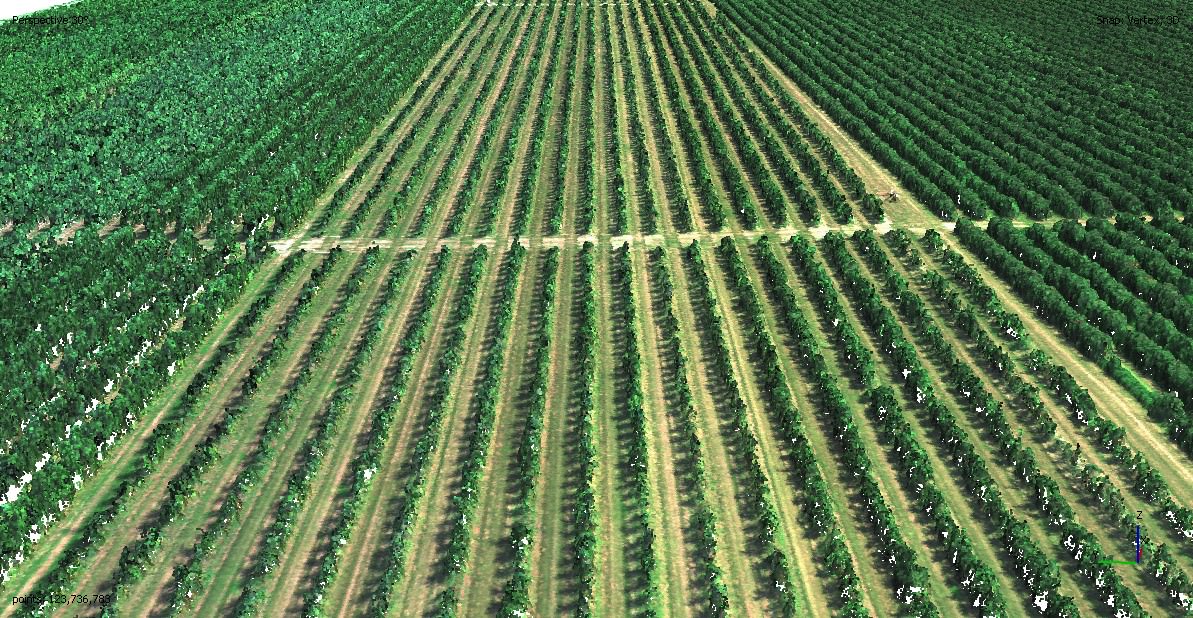
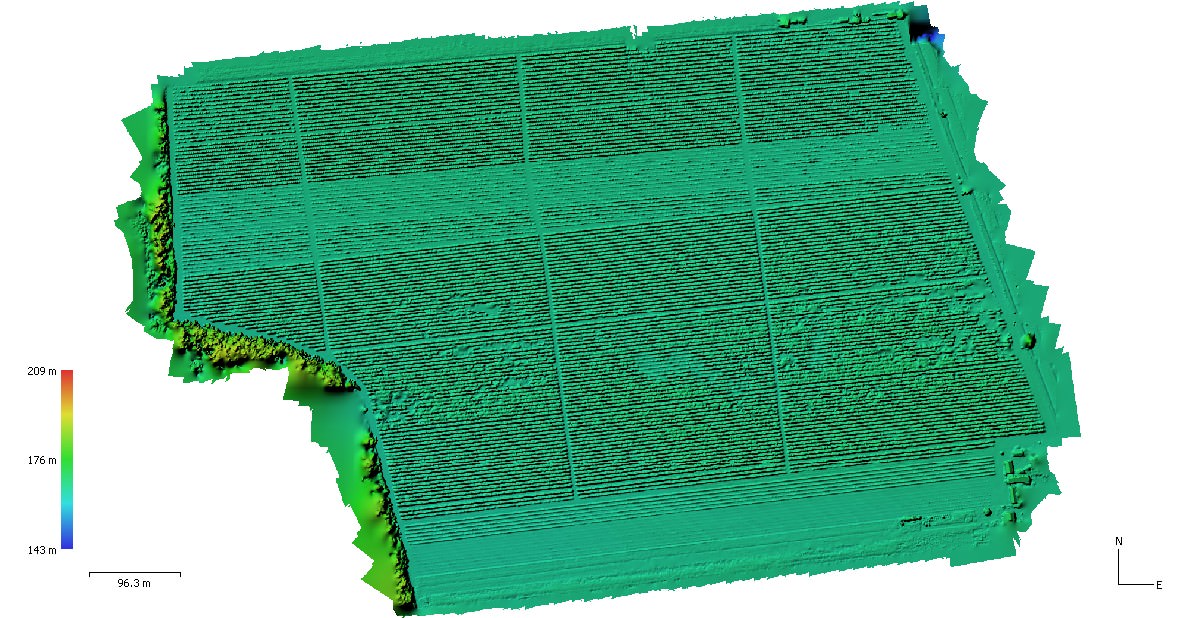
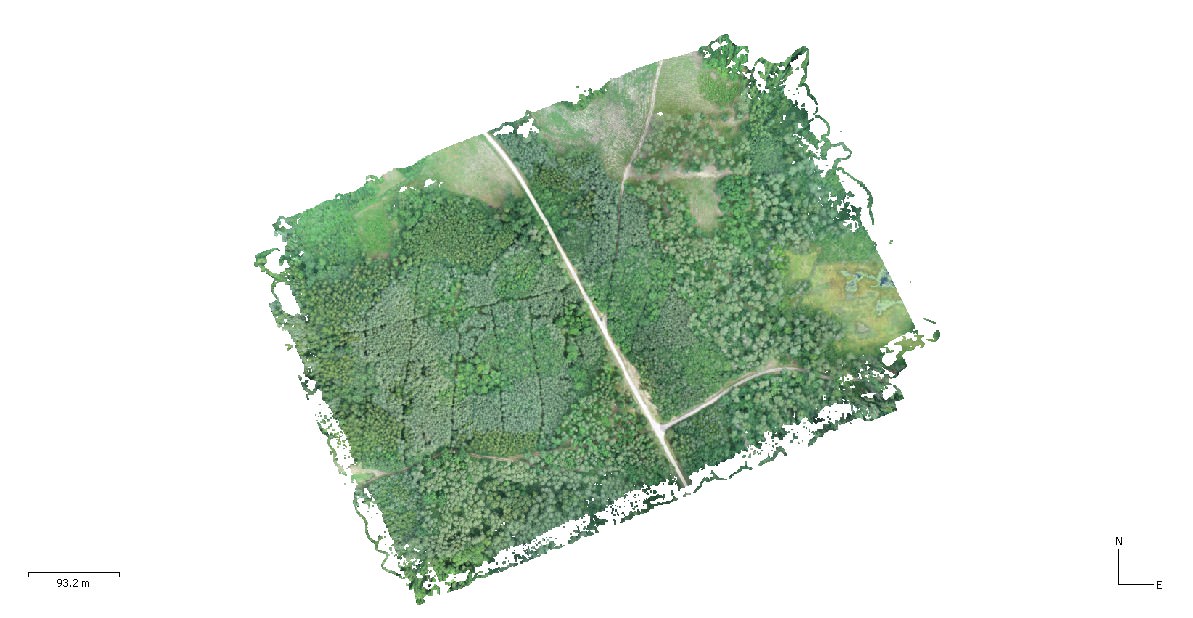
Point cloud - It is a set of points mapping the geometry of the analyzed object or the entire area. It can be the final product of the photogrammetric process, however, most often it serves as an ingredient to create other studies - orthomosaics, numerical terrain models or 3d models.
Point clouds also allow analysis of biomass volumes in agricultural and forestry applications, and heap and landfill volumes in industrial applications.
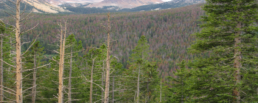
Defoliation - deprivation of leaves of a plant due to external factors or chemicals. Most often caused by insect hail, plant diseases or defoliants (e.g.: thiourea, sodium chlorate).
Herbicides - a type of crop protection products dedicated to weed control.
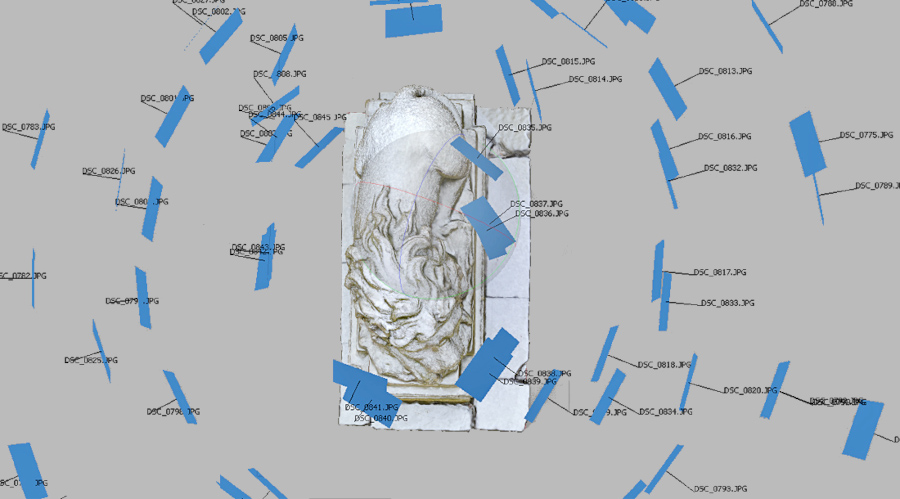
Photogrammetry - is a branch of science dealing with the "transfer" of real objects and areas into virtual form. In the process, it uses photographs taken from the ground with a camera, or from the air - with cameras installed on board a BSL.
In order to reconstruct the geometry of the area of interest, the photos collected during a photogrammetric raid must be processed by appropriate software. It finds common points on the photographs and, based on them, aligns all the images and then begins to reconstruct the geometry of the area of interest in a form and dimensions corresponding to the real one.
The products of the photogrammetry process are: Point Cloud, Numerical Terrain Model, Orthophotomap.
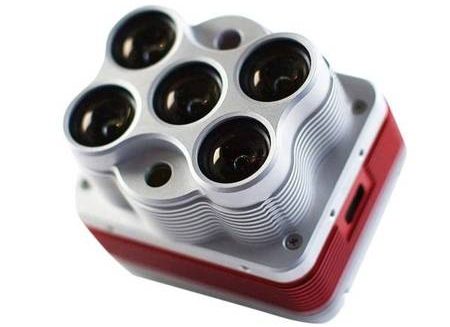
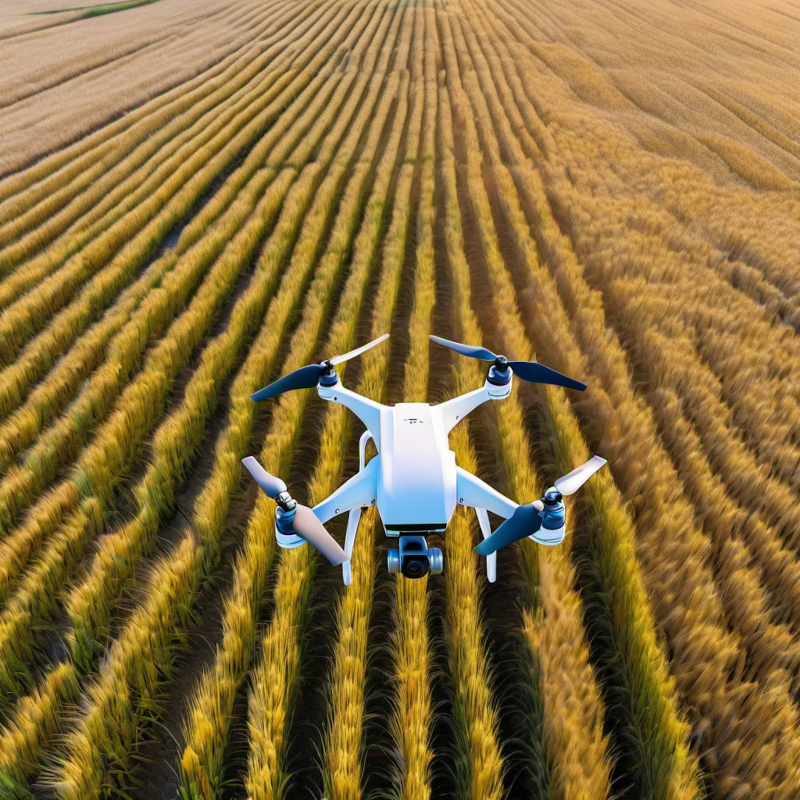
Multispectral camera - this is a type of camera that is capable of recording light in different ranges of the spectrum, including outside the range visible to the human eye (e.g., near infrared or ultraviolet).
Multispectral cameras provide more information about objects and the environment than traditional sensors. Therefore, they are increasingly used in precision agriculture, forestry, environmental monitoring and even urban greenery surveillance.
Most often they take the form of a multi-lens sensor array, where each sensor separately captures light in a very narrow spectrum to then store it as a separate image on a memory card.
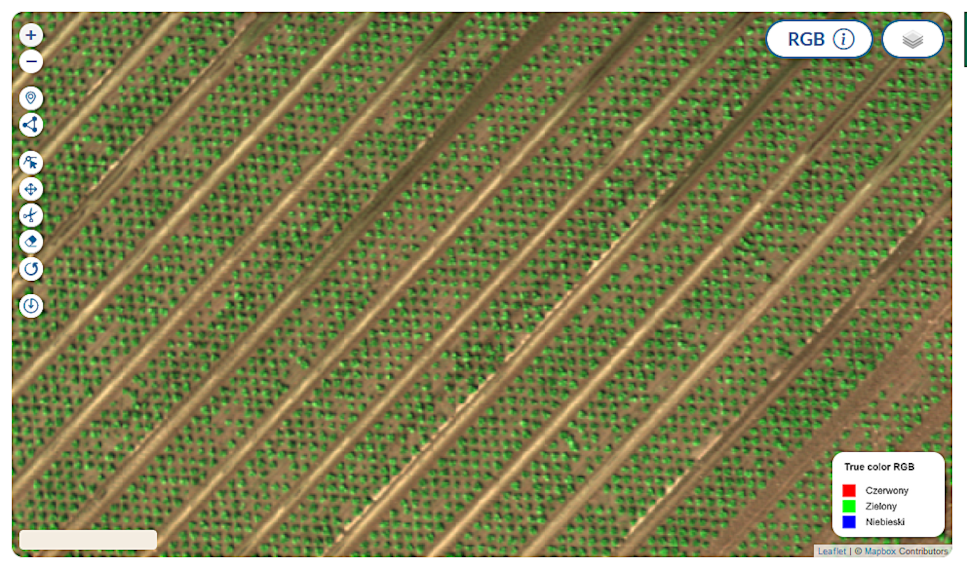
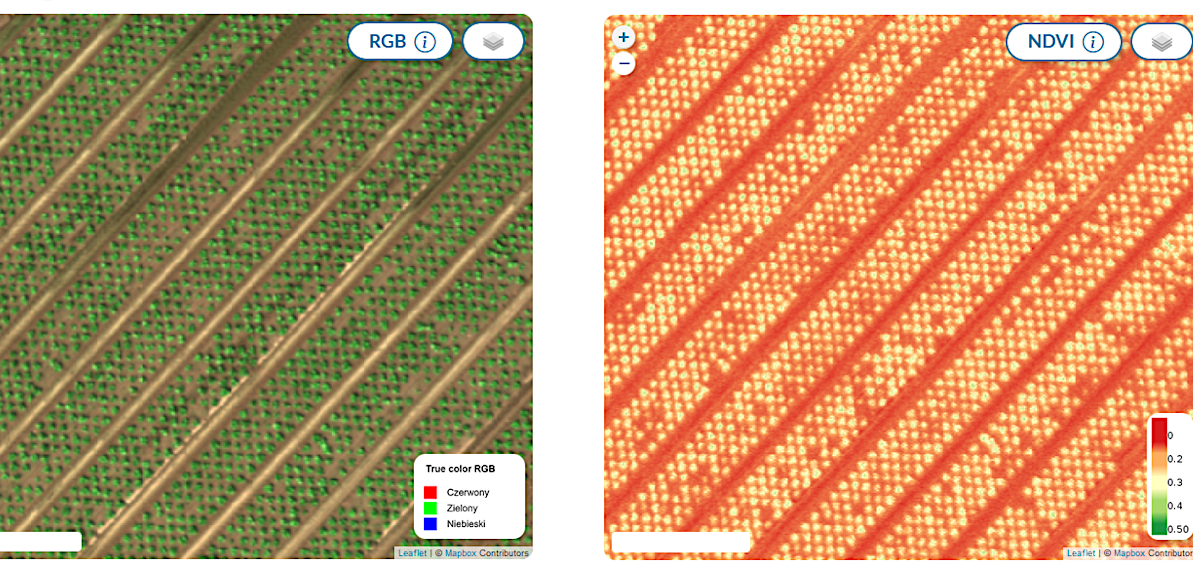
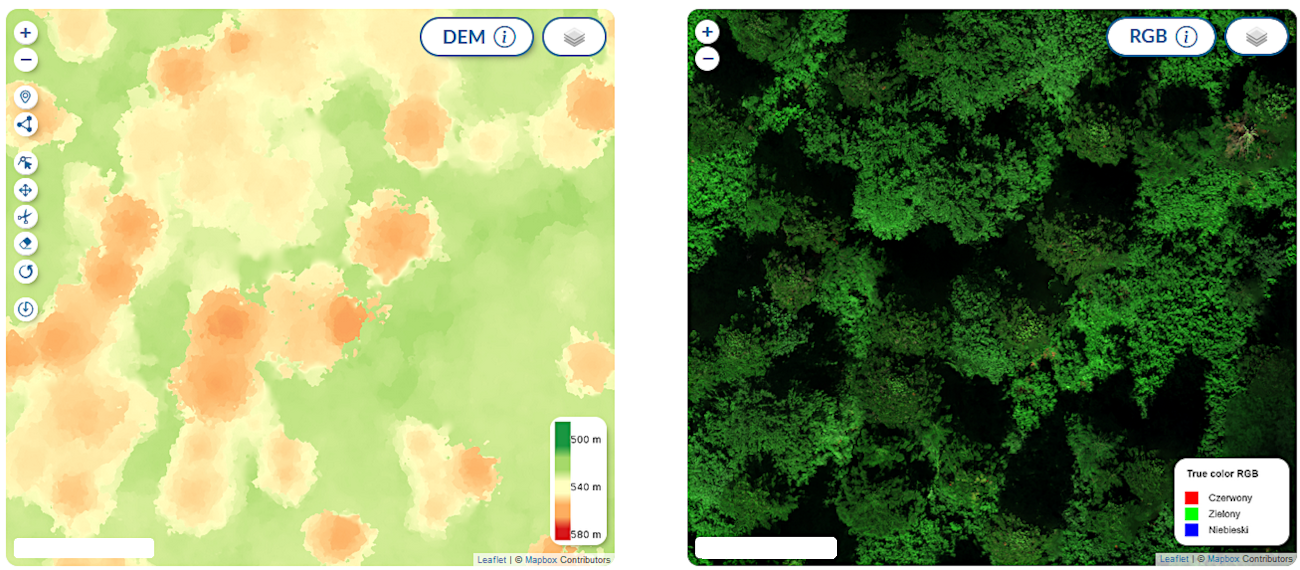
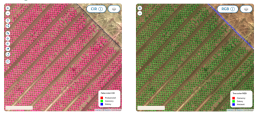
RGB maps - images of this type reproduce the natural composition of colors seen by the human eye. They are also called visible light or true color images (TCI - True Color Image). An RGB image is a raster composed of three channels: Red (R - Red), Green (G - Green) and Blue (B - Blue), combined in that order, mapping the color space seen by the human eye.
RGB images serve primarily as a basis for measuring and classifying objects on the ground. They are not the same as index maps and cannot (without prior processing) be the basis for developing on their basis, such as application maps. RGB rasters are multichannel, and their pixels represent the pixel brightness composition of all 3 channels overlapping at a given location.
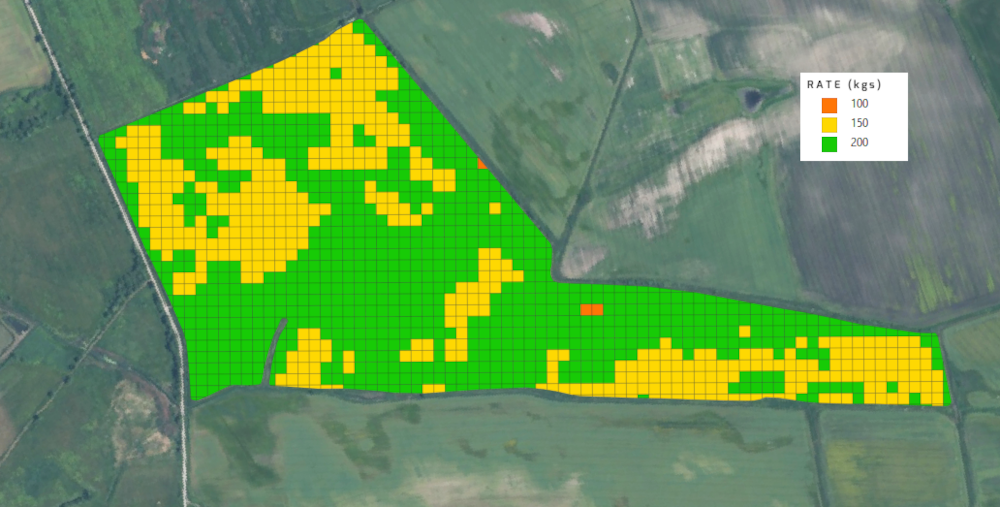
Application map - a map created on the basis of an indicator map that is an "instruction" for a spreader or sprayer informing the machine about the amount of doses to be dispensed on a given section of the field.
The application map takes the form of files in formats: KML, Shapefile or ISO-XML.
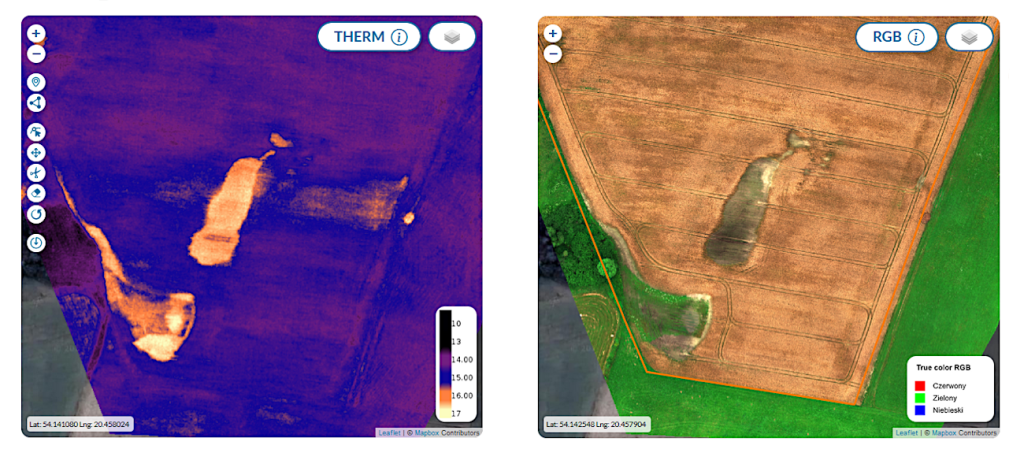
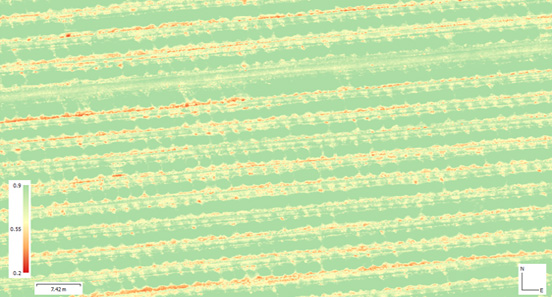
The thermographic map determines the temperature of each pixel recorded on it. It allows assessing the temperature and moisture of the topsoil and examining the degree of leaf transpiration. Higher temperature values can signal irrigation problems, increased susceptibility to drought or agrophage attacks. Lower - potential wetting and outbreaks of fungal diseases.
The ranges of temperatures studied will vary depending on the time of day and the weather conditions under which the flight was performed. Therefore, the map should be analyzed with more emphasis on the differences occurring on a given crop at the same time.
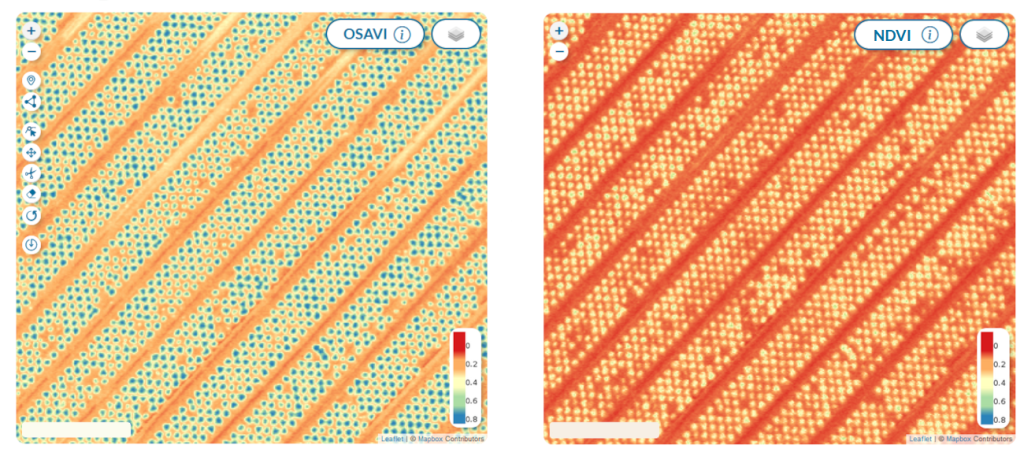
Indicator map - is a visualization reflecting the condition of vegetation in the area we observe. Indicator maps do not take the form of orthomosaics in RGB tones, they are not similar to "classical" images, for the creation of which multiple spectra were used. As derivatives of earlier analyses, a single pixel does not reflect the color of the object located in a given place, but only the value of the indicator calculated on the basis of several channels. Thus, the image is "flattened," so to speak, and takes on a single-channel form, where the colors are merely a visualization of the indicator value in a given area.
However, information about the indicator value is not all that the image cell stores. In addition to it, the pixel is also assigned GPS coordinates, which gives the user a unique opportunity to identify individual problem outbreaks and fight threats in the bud before they spread to larger areas. The information contained in the indicator map is thus the basis for precise conservation and fertilization measures!
In order to be able to fertilize and spray accurately, the indicator map must first be transformed into an application map.

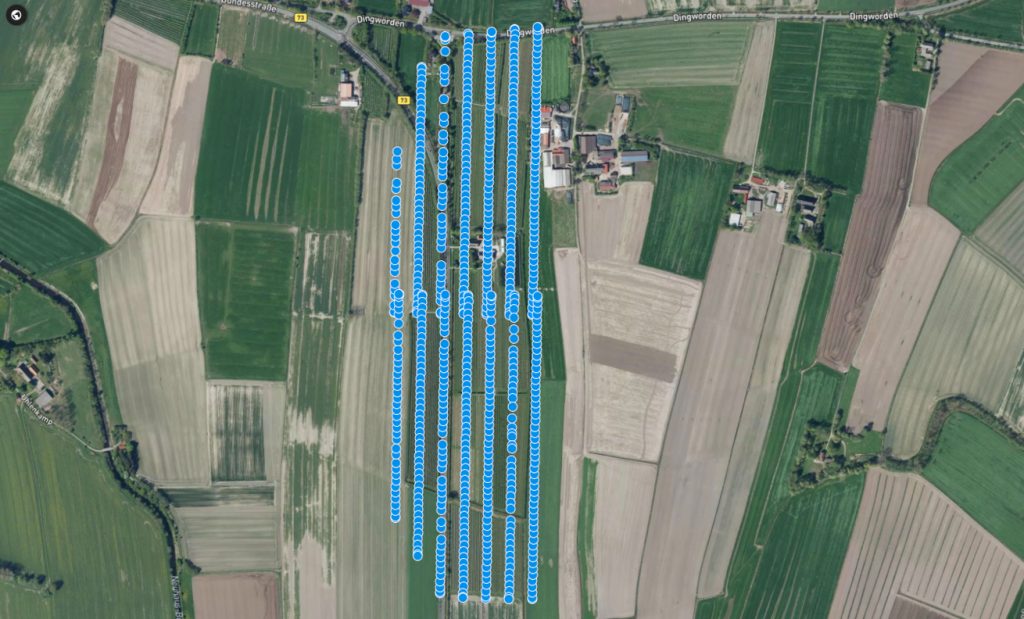
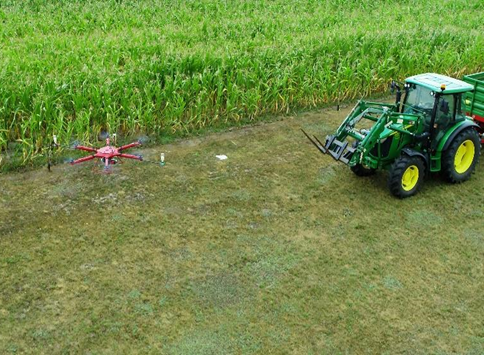
Photogrammetric raid - a flight performed with a BSL (in our case!) along a pre-programmed route taking into account the parameters of the final product (e.g. the need to achieve an image resolution of X cm/pixel).
We performphotogrammetric flights to acquire data for the developed orthophotomaps and index maps. We conduct flights with different sensors on board - RGB or multispectral camera, and the flight parameters of each operation are subordinated to the optical capabilities of the sensor and the assumed size of the terrain pixel (the area of land covered by the size of a single image cell).
The Numerical Crown Model is the result of subtraction of NMPT and NMT resulting in information on the relative height of objects (primarily trees) above the ground surface.
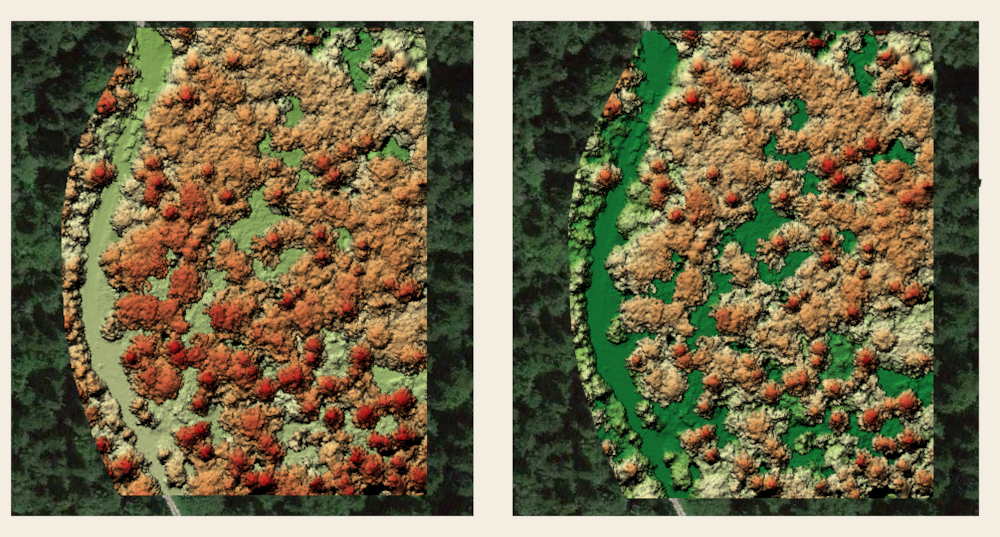
Comparison of the NMT model ( left) and NMK (right). The differences in colors illustrating the height of the recorded terrain are clearly visible. While on the obaz on the left the green tones betray the undulating relief of the area, on the right it is homogeneous - normalized, thus making it possible to know the real height of trees in the mapped area.
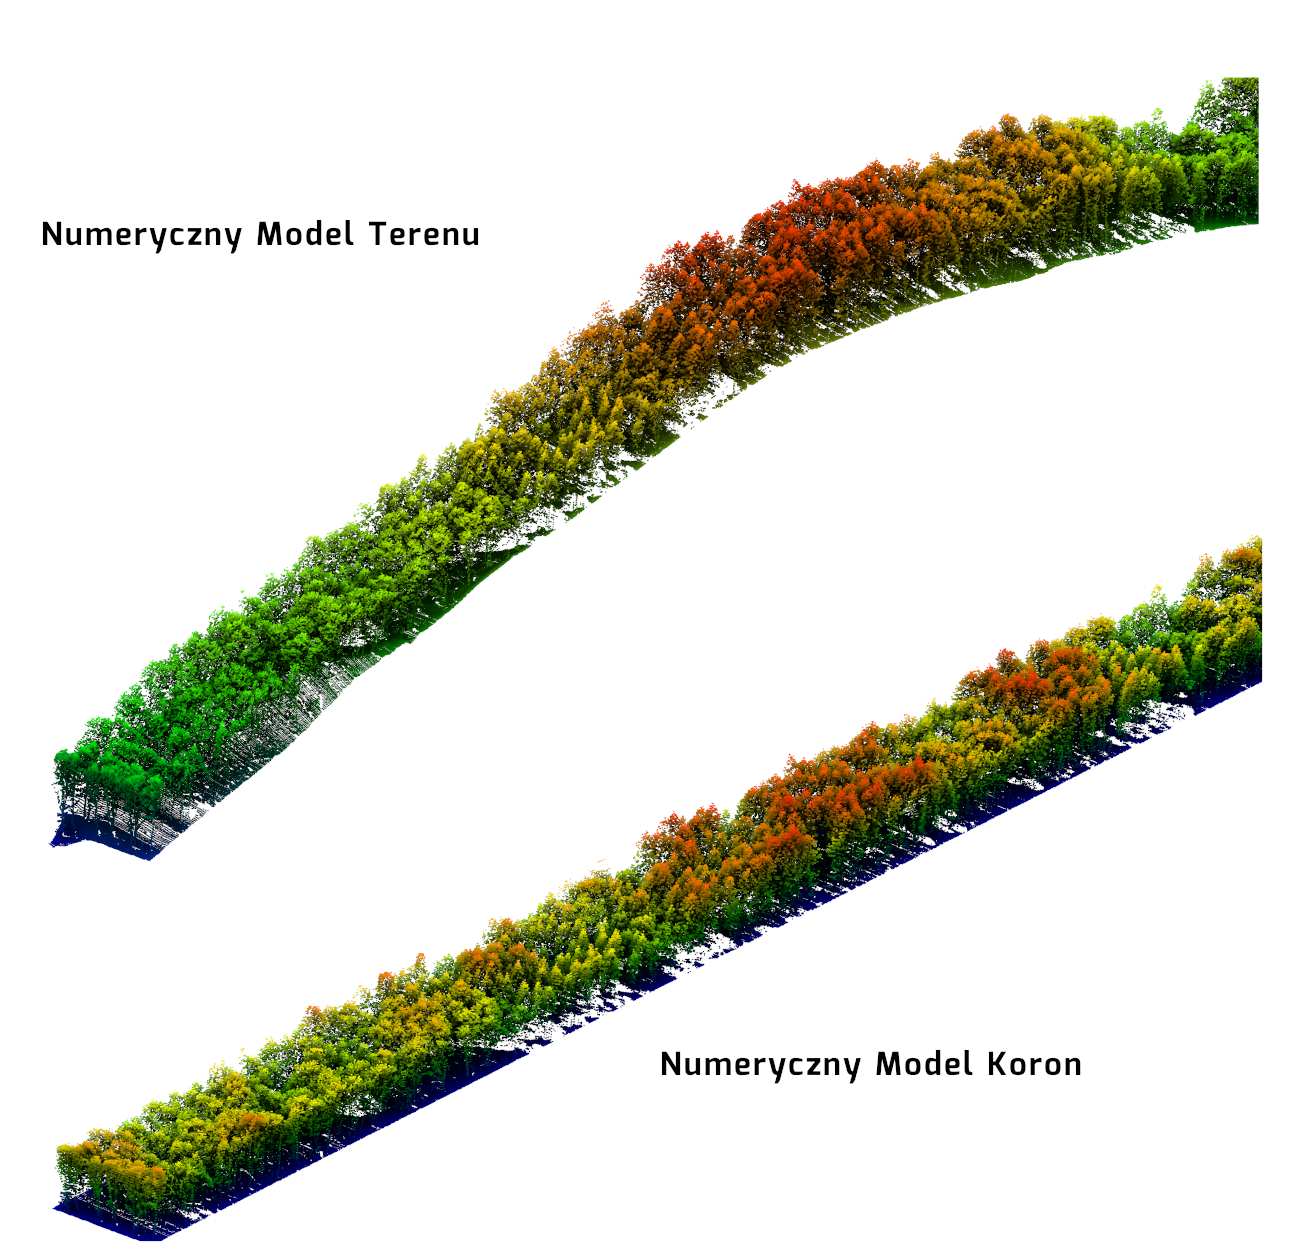
The Numerical Crown Model provides information for many types of analysis useful to Foresters. It allows you to determine the height of a stand, monitor its growth, and, serving as a component, obtain more accurate data on the condition of forest crops.
DEM (Digital Elevation model) - NMPT (Numerical land cover model) - a model of the surface (relief) of the land supplemented with natural (vegetation) and anthropogenic (buildings, structures) elements. Color mapping and to some extent three-dimensional. In the case of stand analysis, it allows:
- Class division linked to tree age - taller trees are older trees
- Tree detection
- Determination of the density of afforestation
- Metric measurements, etc.

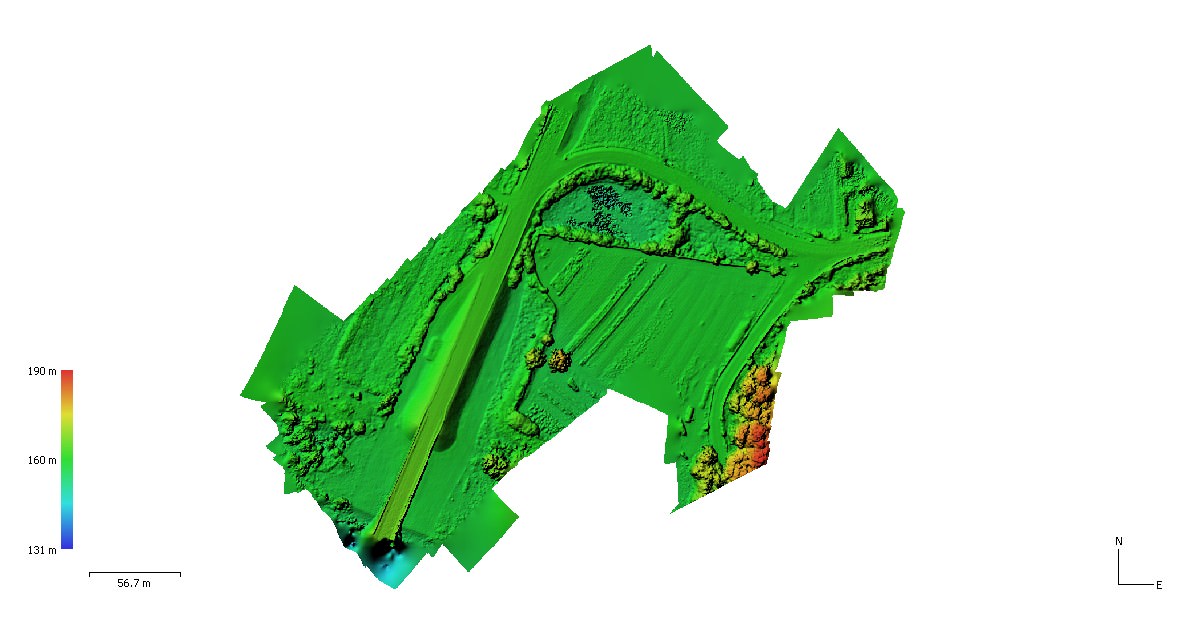
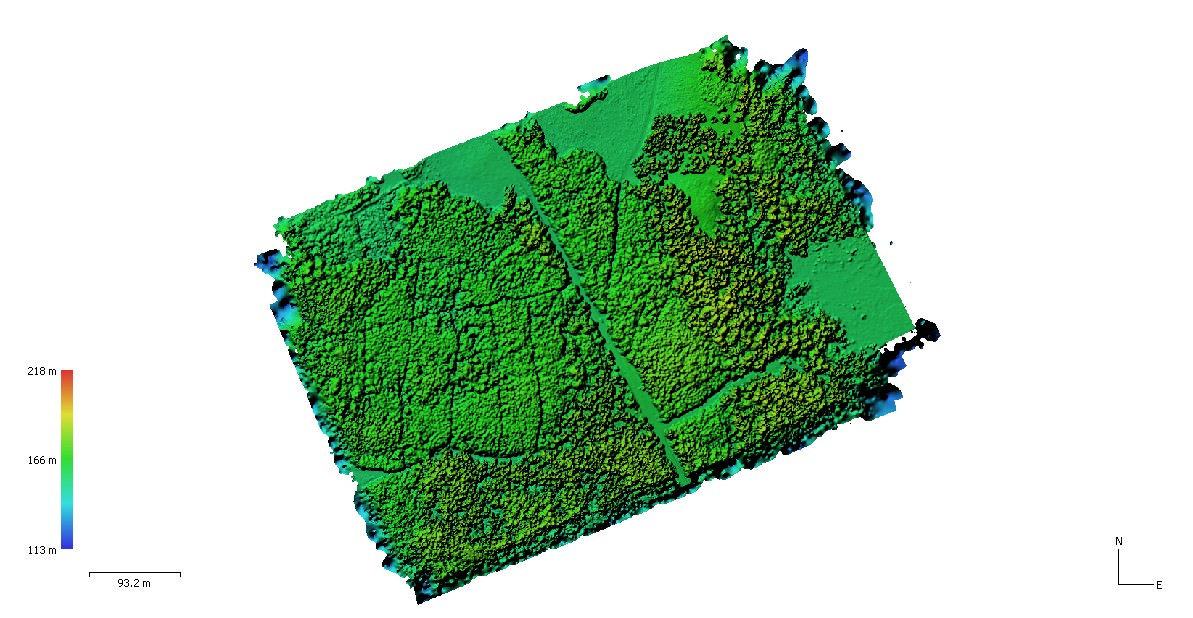
Numerical terrain model - (from DSM - Digital Surface Model, DEM - Digital Elevation Model) is an image, each pixel (cell) of which reflects the height of a point above sea level. It should be noted that the NMT is not a three-dimensional model. It is a so-called 2.5D model because it does not reflect, for example, the geometry of building walls, trunks, or rock walls, but only the height attribute at the cell location.
When talking about terrain models, we usually mention two types of them:
- NMT/DEM - Numerical Terrain Model - reflecting the height of a point above sea level. It is a model mapping only the ground configuration. Without trees, buildings and other objects that are perched on it. This model is an ideal tool for hydrological analysis, for example.
- NMPT/DSM - Numerical Land Cover Model - is a model that stores data on the elevation above sea level of each recorded point, also representing a class of vegetation or buildings.
Orthophotomap - An image of an area of interest made in photogrammetric software by processing a series of images in such a way that the user always views each section of the map from a vertical perspective. This is known as an orthogonal projection, i.e. one that is free of geometric distortions imposed by perspective.
Orthophotos can have different spatial resolution, also known as ground pixel size or GSD (Ground Sampling Distance), which is the size of the area on the ground represented by a single pixel of the map image. It ranges from a few meters per single pixel (maps made on the basis of satellite imagery), through several(tens of) centimeters (aerial orthophotos) to values of single centimeters for maps made on the basis of BSL-acquired data.
Orthophotomap is quite a capacious content category, as it is not limited to maps visualized in visible light (RGB). An orthophotomap will also be a map in CIR tones, an index map, or a thermal map. This is because each of these images was created in orthogonal projection.

Pesticides - synthetic or natural substances used to control harmful or undesirable organisms, mainly used to protect crops and forests.
Multispectral measurements - involve recording images in different spectra (spectra) of light using appropriate sensors. Thanks to the characteristic properties of reflection and absorption of individual light beams for each object, we are able to obtain information of interest, such as determining the degree of vegetation of plants. For multispectral measurements we use satellite images, drones equipped with multispectral sensors and ground-based sensors (sensors).
Precision agriculture - a farming system based on modern information and technological methods. Precision agriculture uses, among other things, unmanned aerial vehicles, multispectral sensors, satellite positioning techniques (GPS) and remote sensing.
Remote sensing - is a technique for collecting information about objects or areas remotely, without physical contact with them. Remote sensing is widely used in a very wide range of fields. It is not limited to agriculture or forestry. Remote sensing methods are also extremely useful in meteorology, environmental monitoring, geology but also, for example, in the realm of security and battlefield reconnaissance.
Remote sensing technologies use data collected by many types of sensors. In addition to the most common RGB and multispectral cameras mounted on drones, we find more complex ones: hyperspectral cameras, LIDARs, radar, or magnetometers.
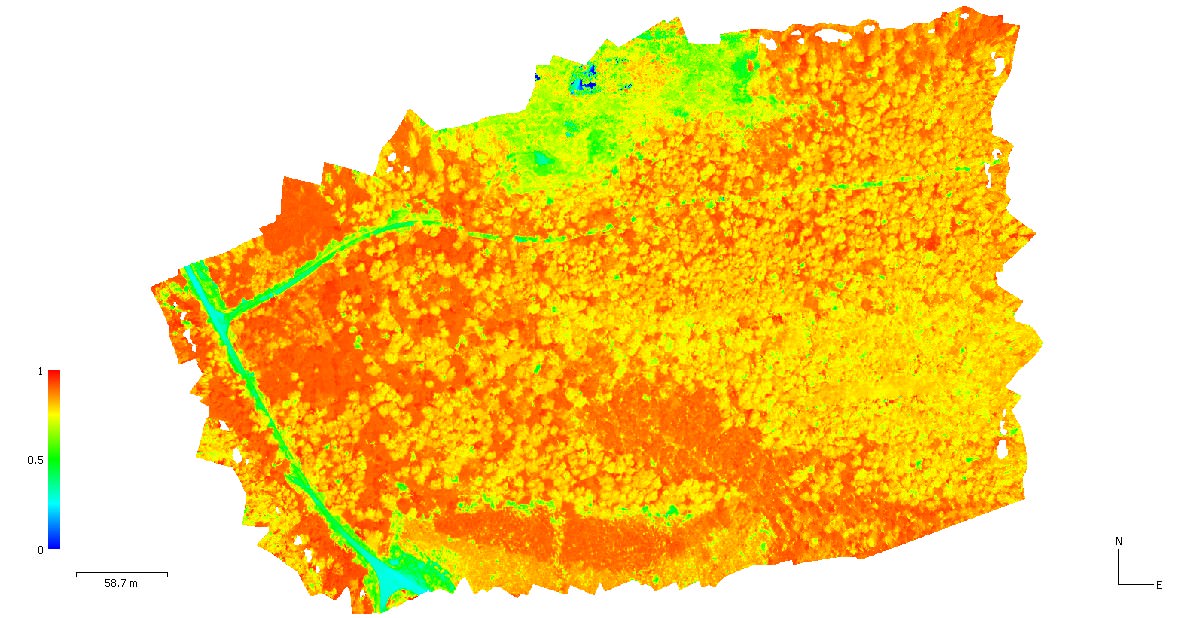
Vegetation index - is a measure that helps us understand whether the plants in the area of interest are healthy and growing undisturbed. Each indicator is an appropriate mathematical formula, using narrow spectra of electromagnetic radiation (because not only visible light!) determining its characteristics and application. This formula can have a very simple form or be enriched with correction factors to filter out noise and better adapt to mapping a particular type of vegetation.
High values of the vegetation index - usually - suggest healthy and lush vegetation, while lower values may indicate problems related to lack of water, plant diseases or other factors affecting their condition. It should be remembered, however, that over the course of the growing season, the values of light reflected from plants change, and an indication that would normally indicate problems signals, for example, a transition from one phase of the season to the next. It is therefore worth using more than one index in parallel to have a complete picture of the vigor of our crops.
More than 500 indices using different electromagnetic radiation spectra are already listed in the databases of vegetation indices. So you can easily find something suitable for your crop!
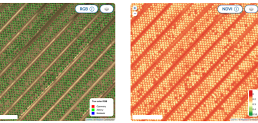
CIR stands for "Color InfraRed" and refers to the use of the near-infrared (NIR) spectrum in place of the blue spectrum in image composition. False-color imagery (as CIR is also called) is used in remote sensing to enhance the interpretive capabilities of vegetation, soil, or water without the need for vegetation indices.
CIR is excellent at visualizing differences in field irrigation and is great at delineating the boundaries of water bodies, which in agriculture translates, for example, into easier estimation of the size of areas that are flooded or have irrigation problems. Light and desiccated soils will have a much lighter hue than those that contain more organic matter or are wetter, which translates into the color of the recorded image. In the context of soils, CIR will allow us to distinguish sandy regions from more clayey ones much more easily than, say, an RGB image.
A characteristic feature of CIR images is that the colors of vegetation change from green (as we see it every day) to red and the ground shifts to earthy, blue and even green. Due to the complete absorption of light in the near-infrared spectrum by water, puddles, stagnant and other flooded areas are perfectly visible in tones close to black.
EVI - (Enhanced Vegetation Index) an index, like NDVI, for monitoring vegetation. It was introduced to improve on some of the limitations of NDVI and is commonly used in more demanding applications, such as forest area monitoring.
EVI is preferred in situations where atmospheric conditions can affect the accuracy of measurements. This happens not infrequently with NDVI, not only with variable cloud cover but even when the sky is cloudless and the images were recorded at different times of the day.
EVI, thanks to the enrichment of the formula with weighting and correction factors, avoids over-saturation of soil reflectance in the early stages of growth and the replacement of the red spectrum with edge red allows for more faithful results for tall or complex vegetation.
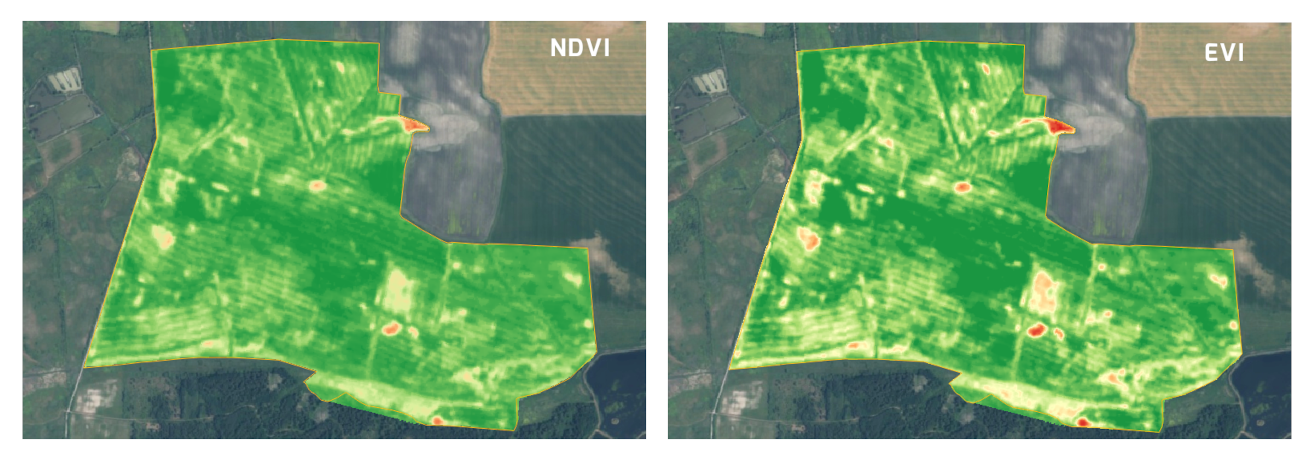
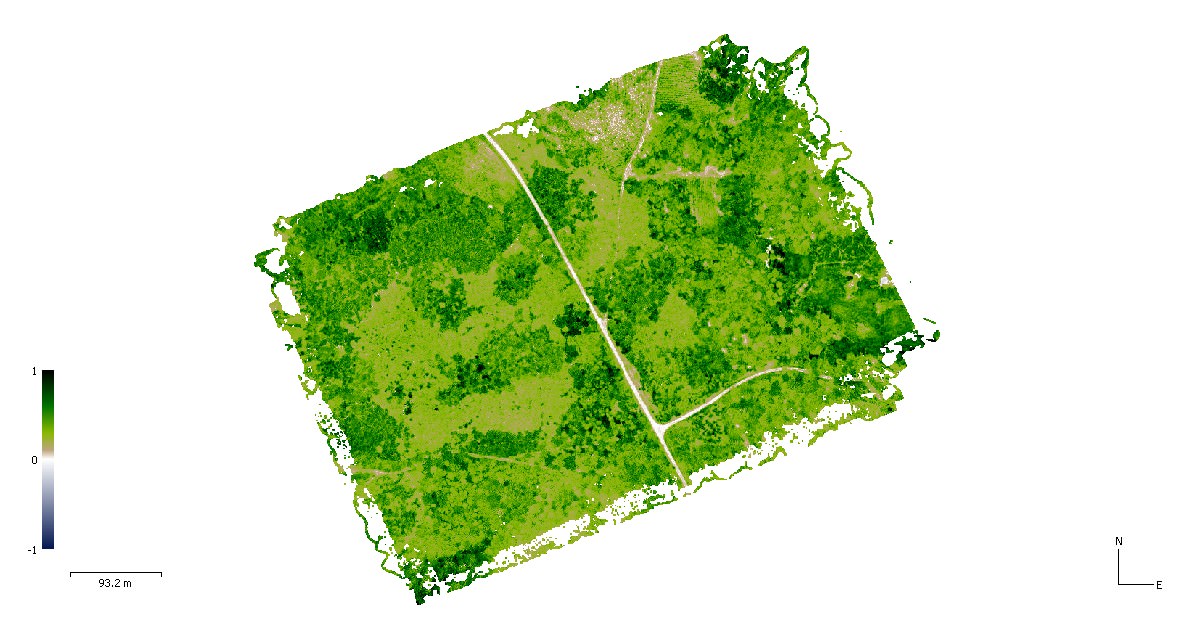
The NDVI - (normalized differential vegetation index) - is a basic indicator to measure the condition of vegetation. Its formula includes the use of red and near-infrared channels.
Higher values indicate more photosynthetically active biomass. Lower values may indicate weakened vegetation, lack of vegetation or the final stages of the vegetation cycle.
The indicator's high sensitivity to bare ground reflectivity makes it worthwhile in the early stages of development to support the analysis with, for example, OSAVI, which will provide more accurate indications of reflectivity through vegetation.
NDVI usually takes values in the range of -1 to 1 although - if the mapped area contains, for example, highly reflective objects (such as the steel roof of a building) - the range of indications may increase.
The indicator takes values between -1 and 1, which are mapped in color on the map:
- Below 0.2 - areas without vegetation, such as exposed soil, dead organic matter, water, snow, buildings, etc.
- Between 0.2 and 0.4 - residual vegetation
- Between 0.4 and 0.7 - vegetation in good condition
- Above 0.7 - vegetation in very good condition. However, it should be borne in mind that the range of the indicator can be affected by various factors (different type of crop, place of cultivation, etc.), so it is useful to refer to the average values of the indicator across the field and historical data to make a good assessment of the condition of the stand.
The NDRE - (Normalized Difference Red Edge Channel Index) is similar in its formula and application to NDVI. However, instead of the near-infrared band, it uses the Red Edge channel, making it more sensitive than NDVI to even the slightest changes in vigor.
The RedEdge spectrum is less susceptible than the Red and Near Infrared channels to atmospheric interference, or the effect of light angle, which helps provide more precise data under polluted atmospheric conditions or early in the vegetation cycle. It also makes it possible to better distinguish between different phases of plant growth, such as the vegetative phase or the maturation phase, which is important for monitoring vegetation at different stages of its development.
The use of RE allows recording more subtle changes in the chlorophyll content of plant leaves - importantly! - not only in the top parts of the plant, which translates into a more accurate assessment of the condition of the entire plant.
Replacing the Red Spectrum Indicator in the formula with RedEdge results in another extremely important feature: namely, it makes the NDRE allow for a much more accurate assessment of nitrogen content in plants, which is crucial from the point of view of precise fertilization with this element.

OSAVI -(Optimized Soil-Adjusted Vegetation Index) is one modification of the NDVI index that was developed to reduce the impact of soil on vegetation index values. OSAVI is particularly useful in areas with a significant soil background and during periods of emergence when young plants - although healthy - do not yet cover enough area around them with leaves, which translates into low NDVI readings.