KNOWLEDGE BASE
Bonitification, stand classification – an indicator of the production capacity of a forest site for a given species. The rating class is determined by the age and height of the stand.

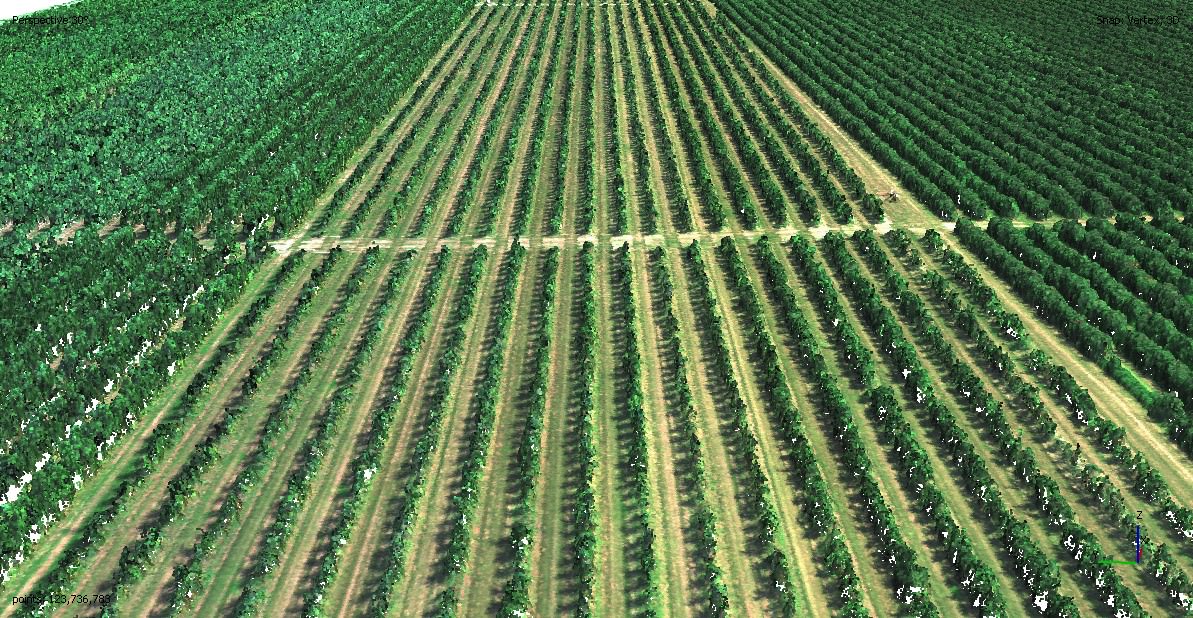
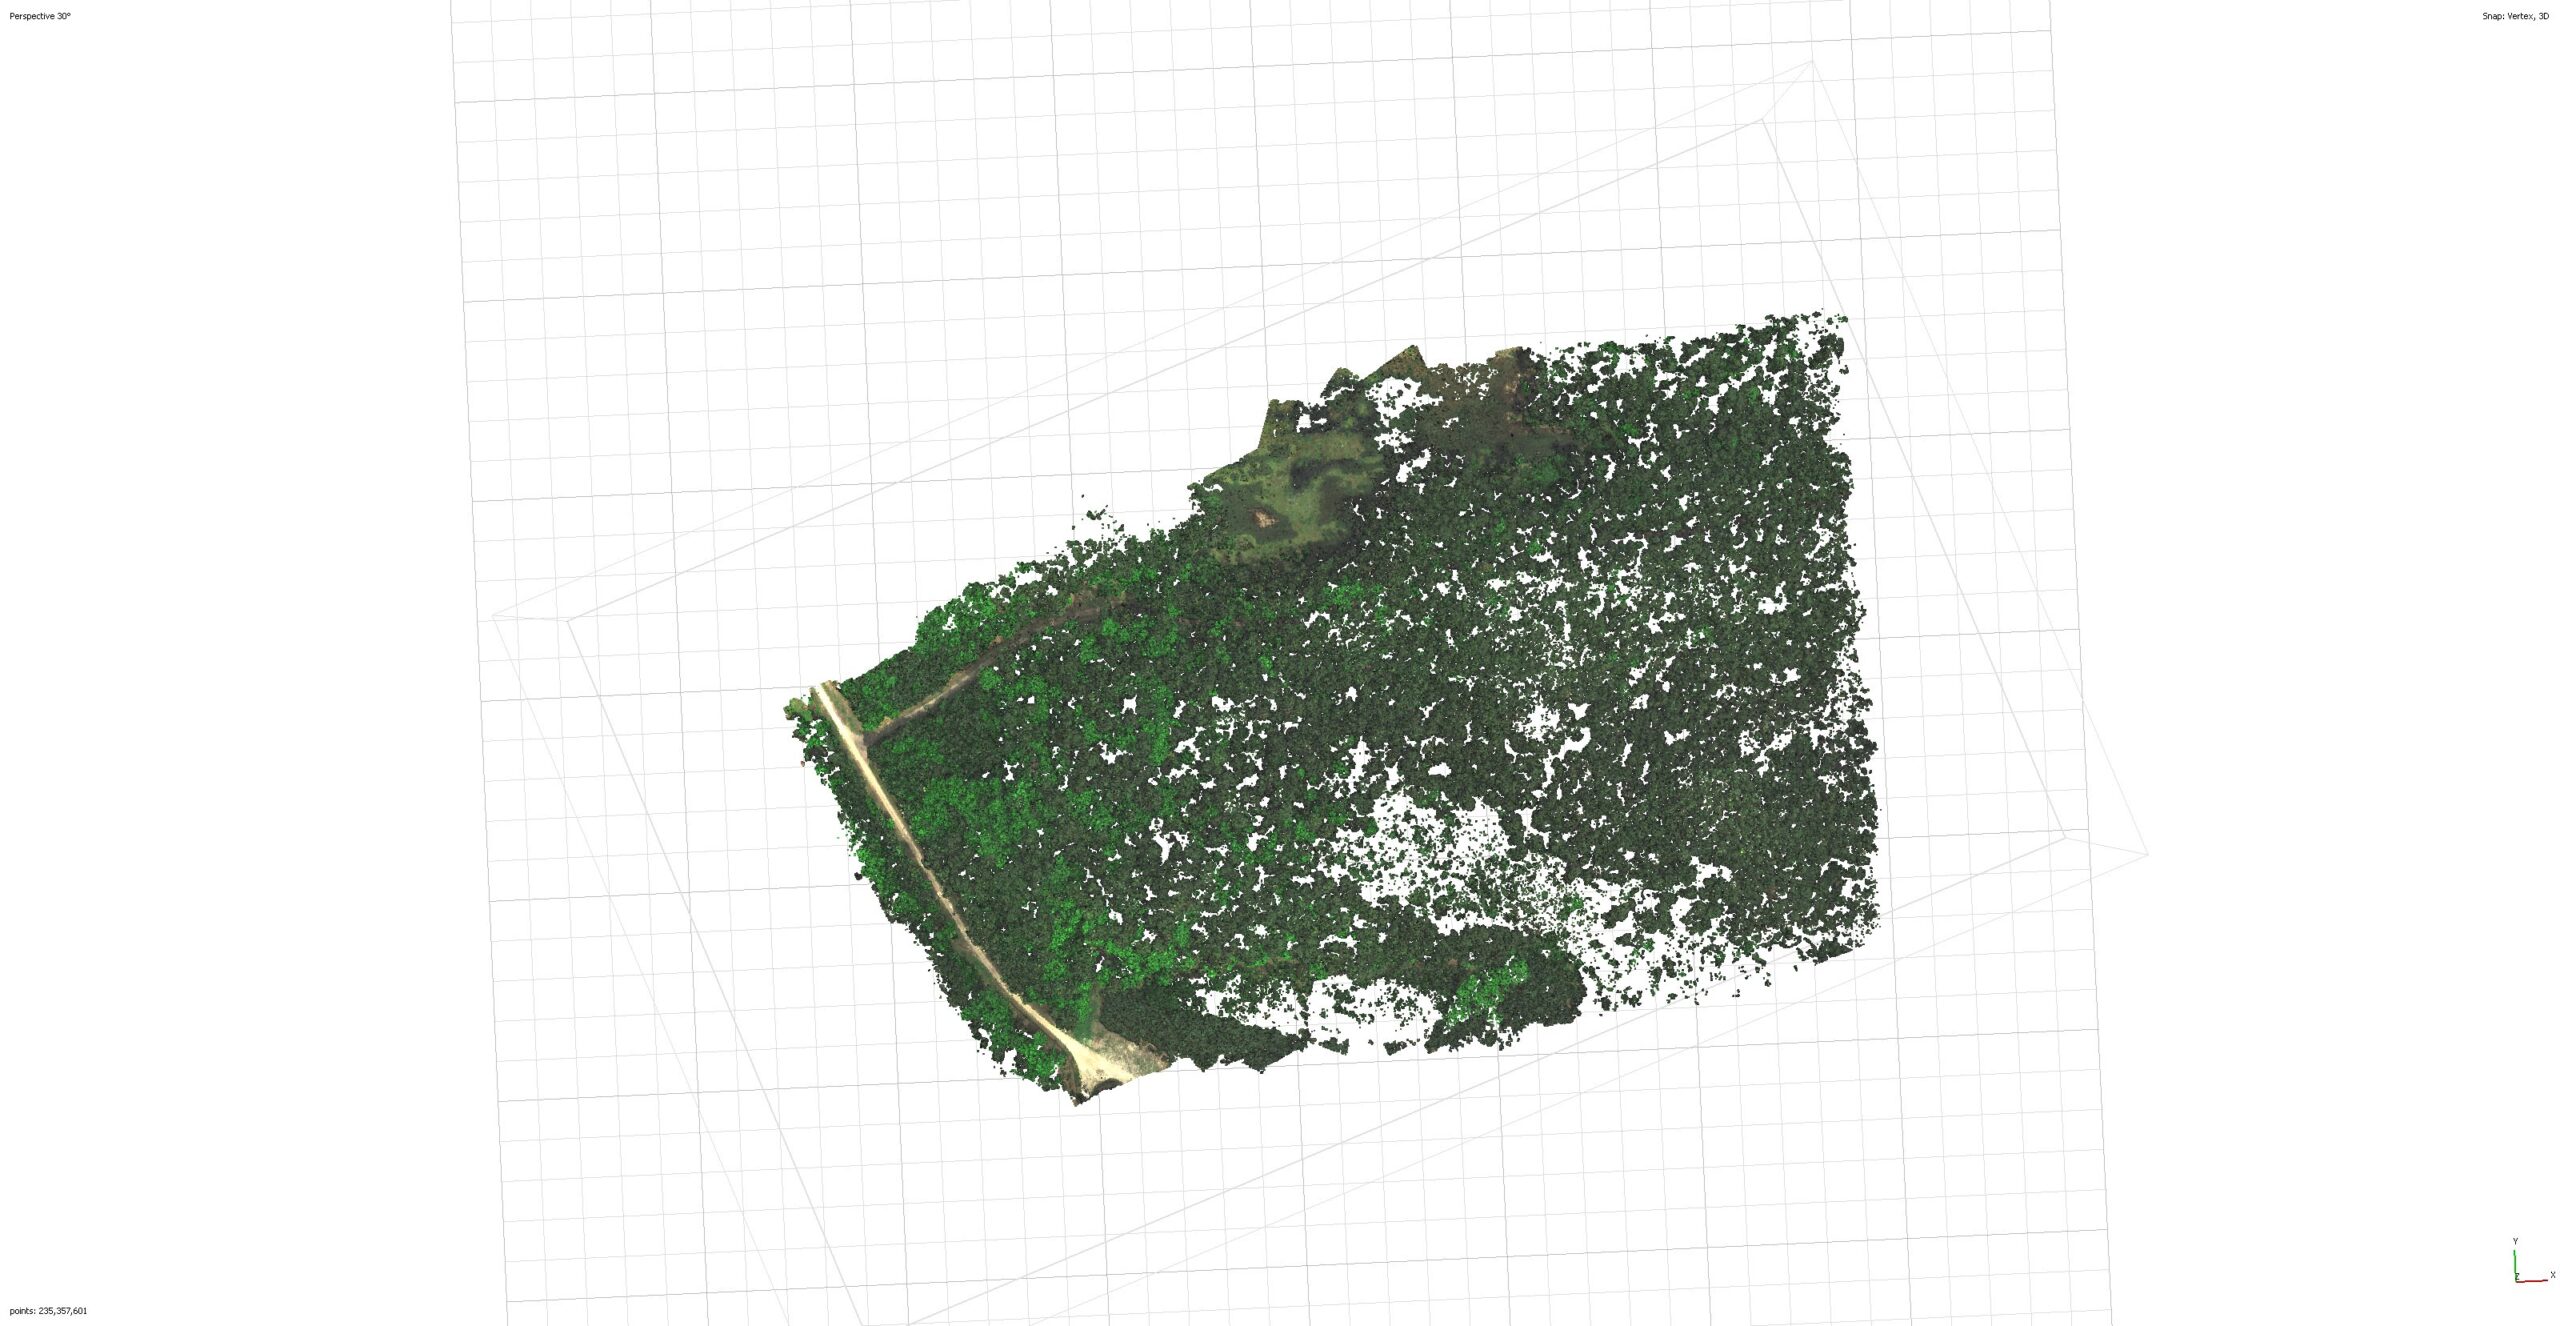
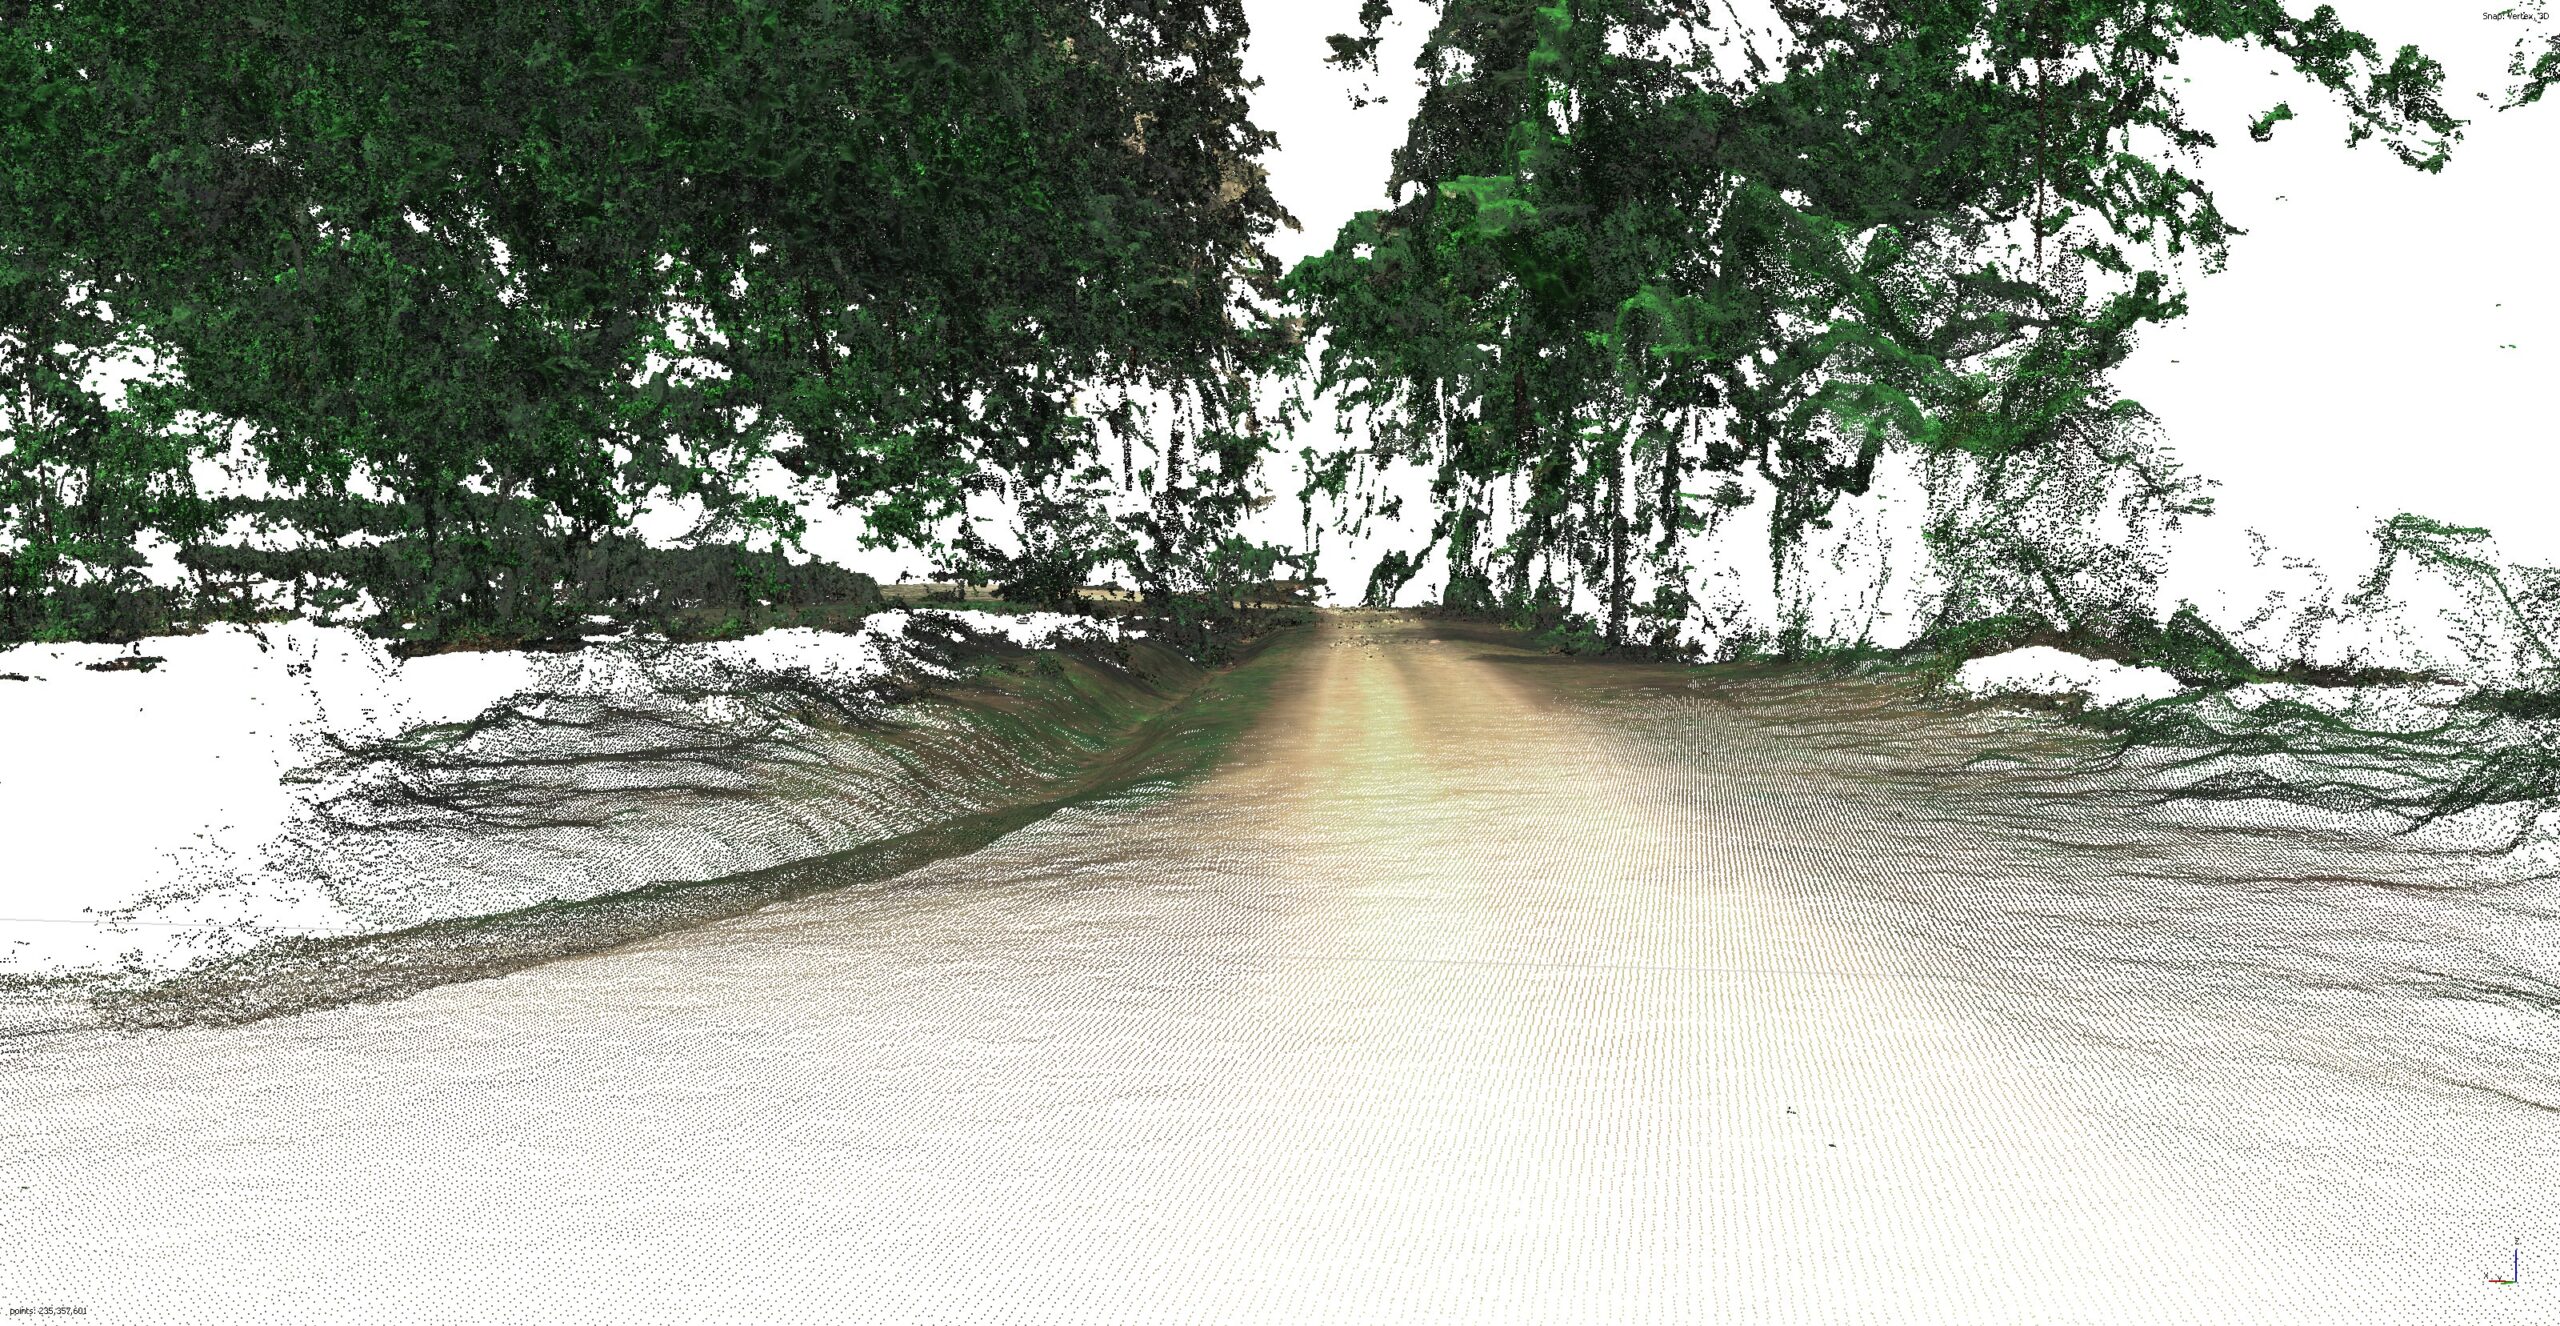
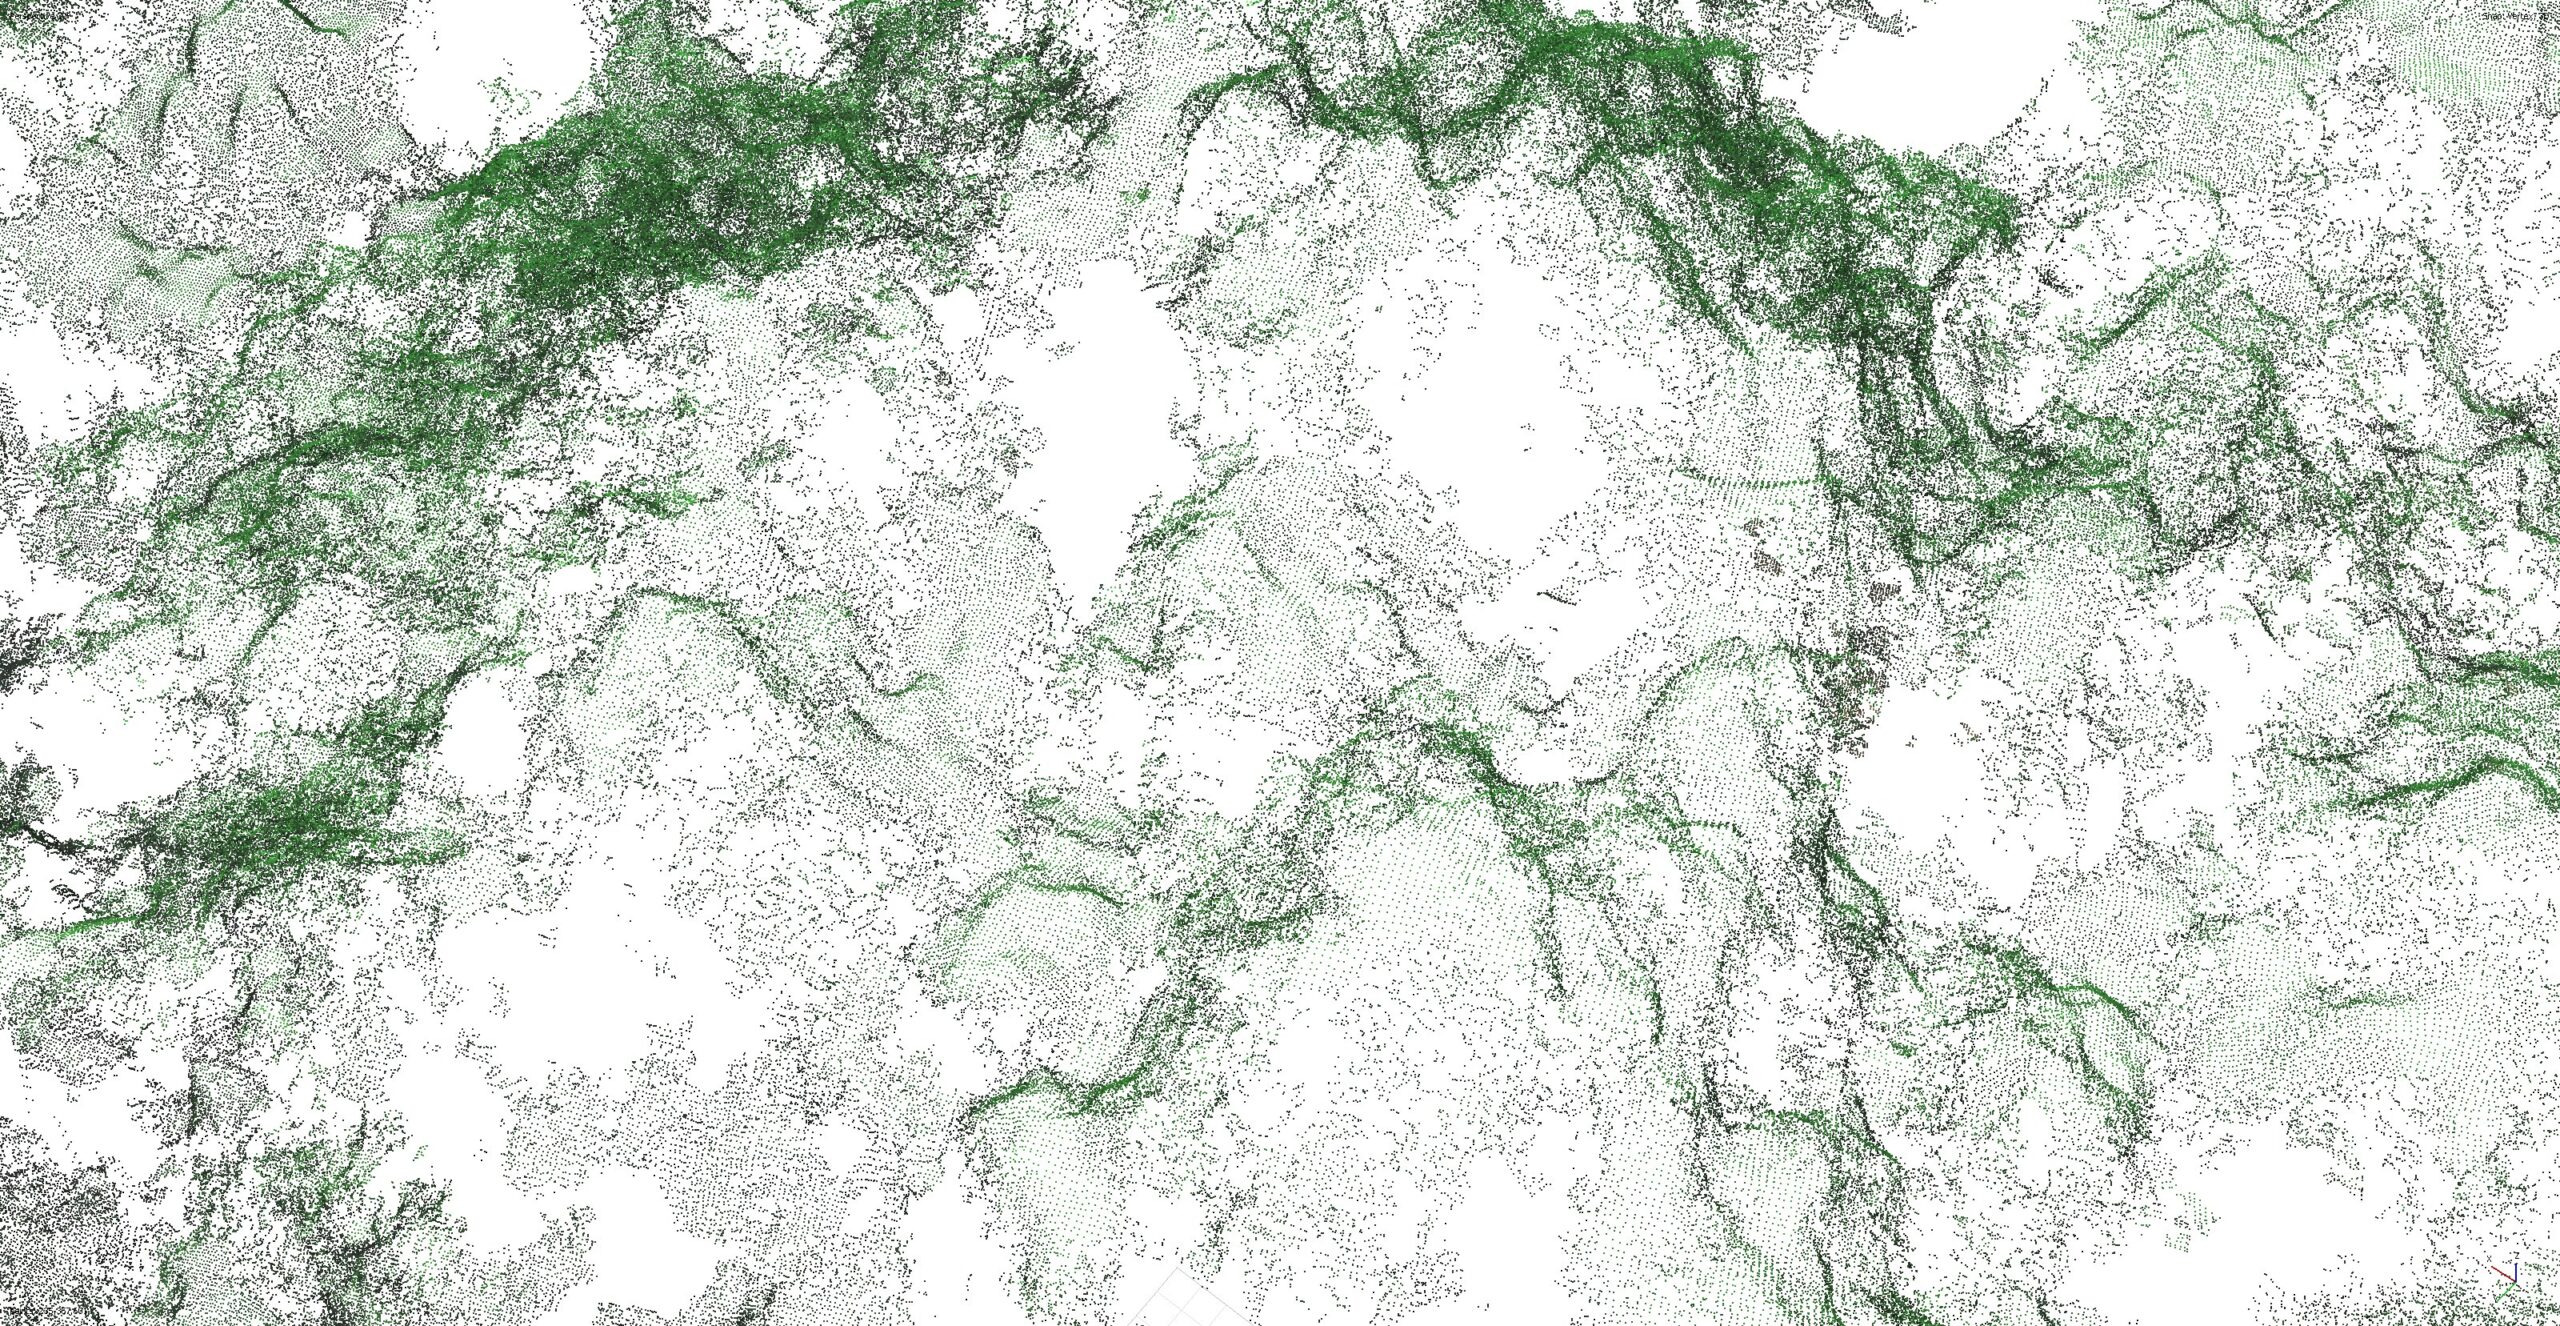
Point cloud – a set of points with XYZ coordinates and a reflectance parameter, which is a geometric representation of the scanned object. It can be acquired using an indirect method (photogrammetry) or a direct method (electromagnetic scanning).
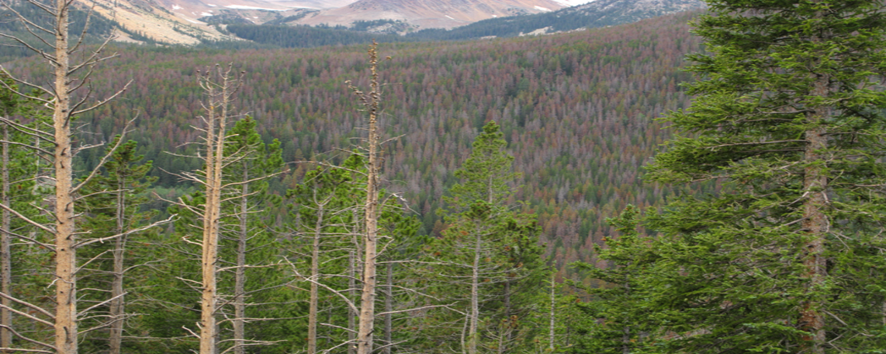
Defoliation – depriving the plant of leaves due to external factors or chemical substances. Usually caused by insect infestations, plant diseases or defoliants (e.g. thiourea, sodium chlorate).
Photogrammetry/strong> – (according to the Great PWN Encyclopaedia of 2002) is a branch of technical sciences dealing with the acquisition, transformation, presentation and collection of information (quantitative and qualitative) about a given area or object on the basis of photogrammetric images (i.e. terrain photographs, so-called photograms) or their digital representations.
Herbicides – a type of pesticide used to control weeds.
Application map – – a map created on the basis of an indicator map as an “instruction” for precise fertilisation or individualised spraying. It enables the farmer to significantly reduce the use of fertilisers, plant protection products (pesticides) and herbicides.
Indicator map – – a map showing the condition of an agricultural field or forestry section. Behind each indicator is an appropriate mathematical formula, determining its characteristics and application. The components of the formulae are the reflectance values of individual light beams.
Photogrammetric raid – A raid performed with a manned or unmanned aircraft equipped with a suitable sensor (e.g. multispectral sensor or digital camera) to collect photogrammetric and/or remote sensing data. These include orthophotos, 3D models, numerical land cover models, index maps, etc.


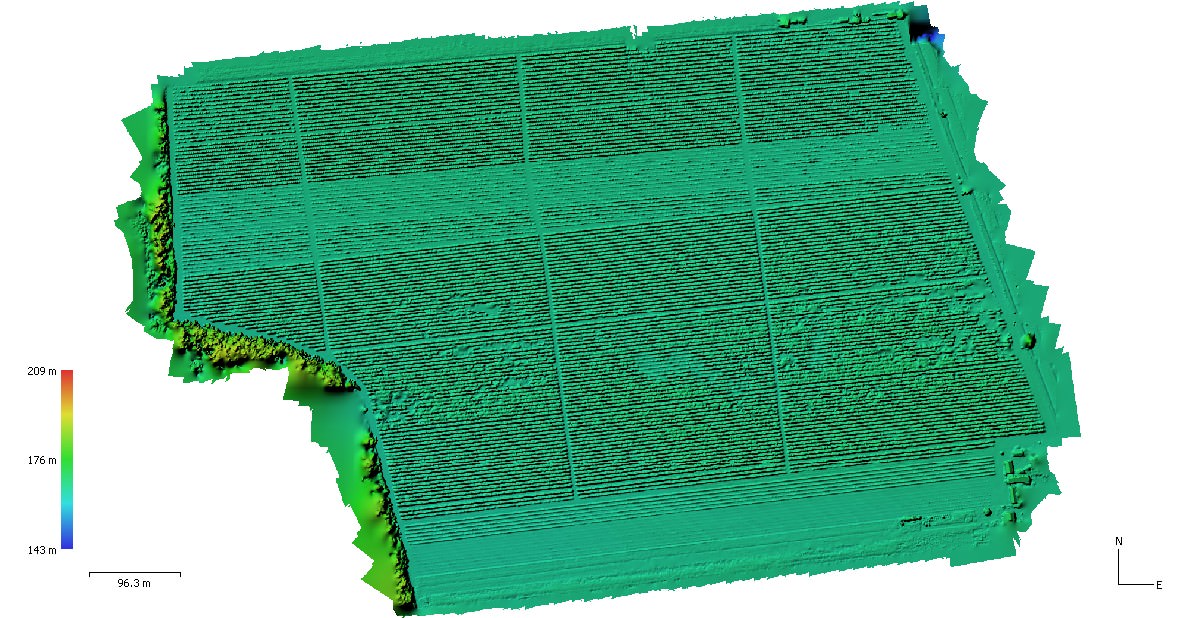
Numerical terrain model – A digital representation of the land surface, used for many geospatial analyses and measurements.
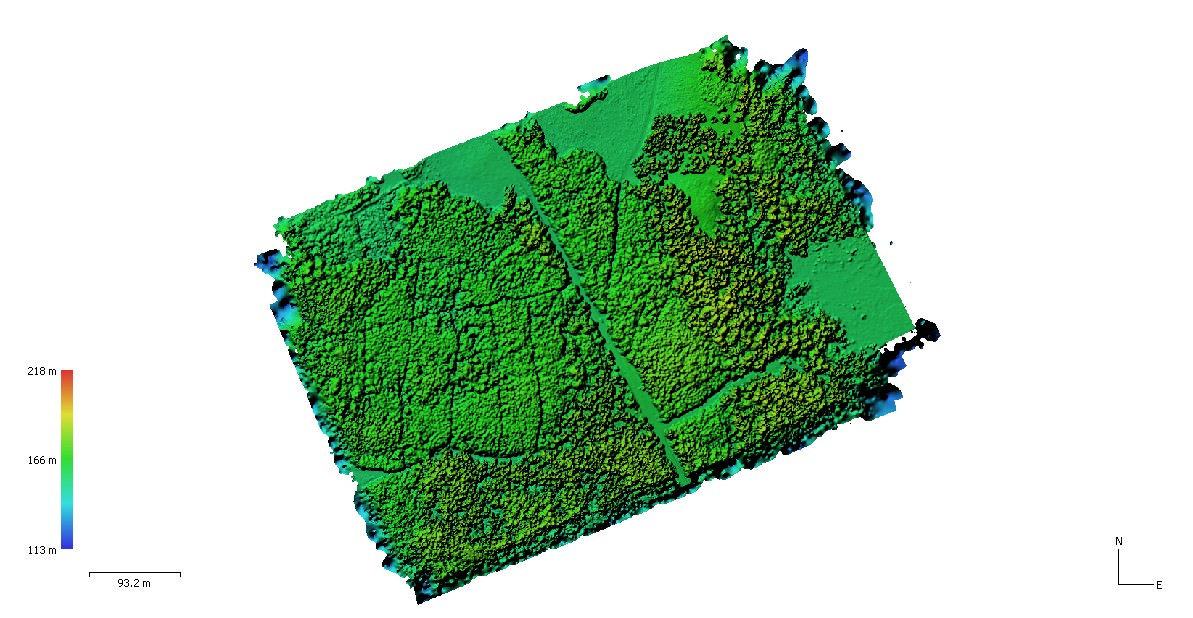
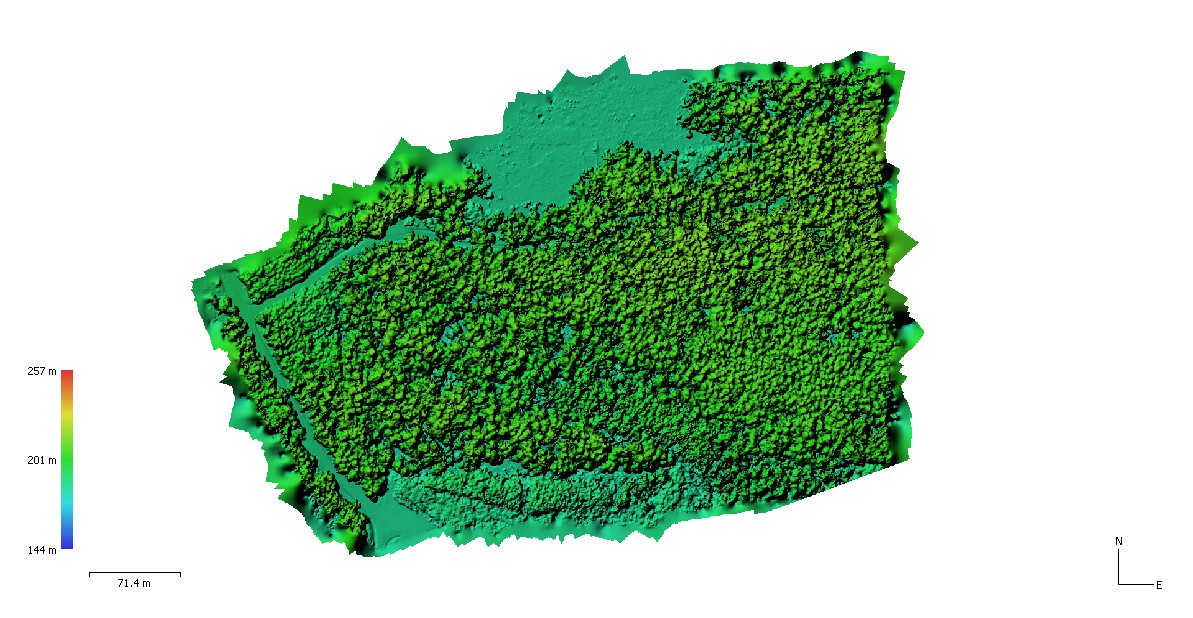
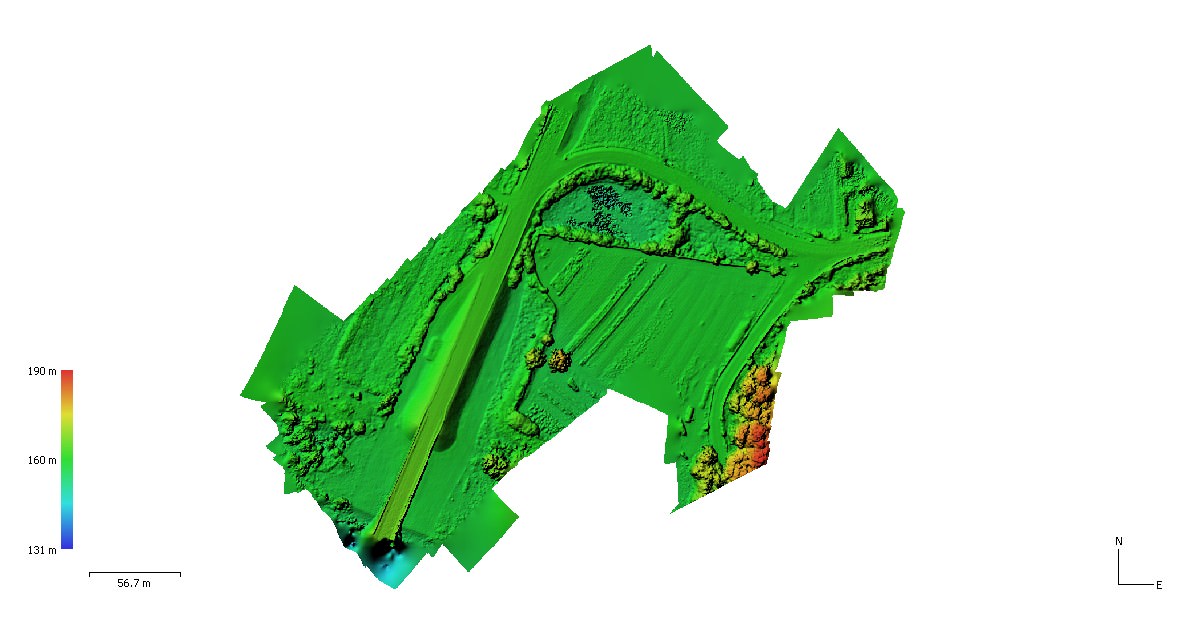
Numerical land cover model – land surface model supplemented with natural (vegetation) and anthropogenic (buildings, structures) elements. It is the basis for developing digital 3D models.

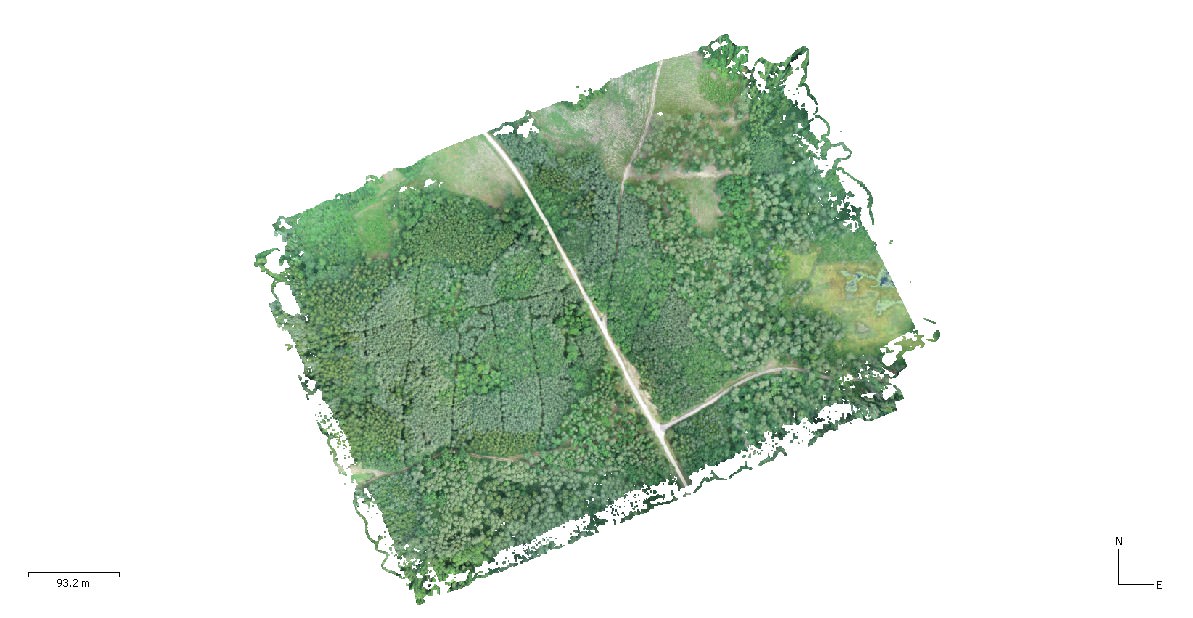
Orthophotomap – a map showing the surface of the terrain created as a result of processing aerial or satellite images. The image is in orthogonal projection, i.e. the way a standard map is presented.

Pesticides – synthetic or natural substances used to control harmful or undesirable organisms, mainly used to protect crops and forests.
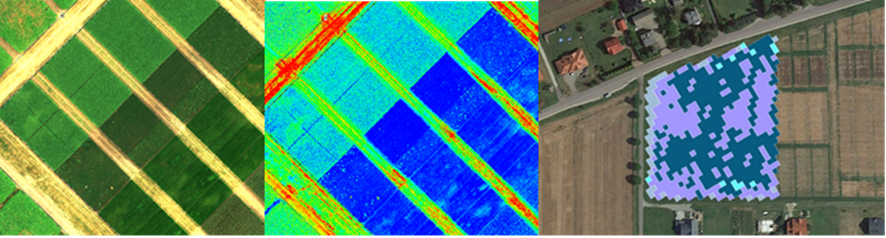
Multispectral measurements – consist in the registration of images in different spectra (spectrums) of light with the use of appropriate sensors. Due to the reflection and absorption properties of particular light beams, which are characteristic for each object, we are able to obtain the information we are interested in, e.g. determine the vegetation stage of plants. For multispectral measurements we use satellite images, drones equipped with multispectral sensors and ground-based sensors.
Precision farming – a farming system based on modern information and technology methods. In precision agriculture, we use, among other things, unmanned aerial vehicles, multispectral sensors, satellite positioning techniques (GPS) and remote sensing.
Multispectral sensor (camera) – a sensor that captures images in several different light spectra, including near-infrared. It is used to create indicator maps.
Remote sensing – involves recording data and information about the physical world by detecting and measuring signals created by radiation, particles and fields emitted by objects outside the immediate vicinity of the sensor (which records these data).
Normalized Difference Red Edge Channel Index – similar in its formula and application to NDVI. It uses the red edge channel instead of the near-infrared band. This makes it more sensitive than NDVI (faster problem detection) and allows measurement of lower canopy and dense vegetation.
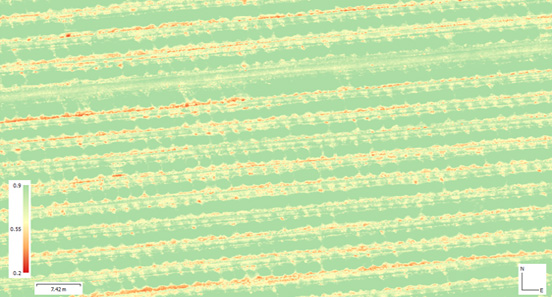
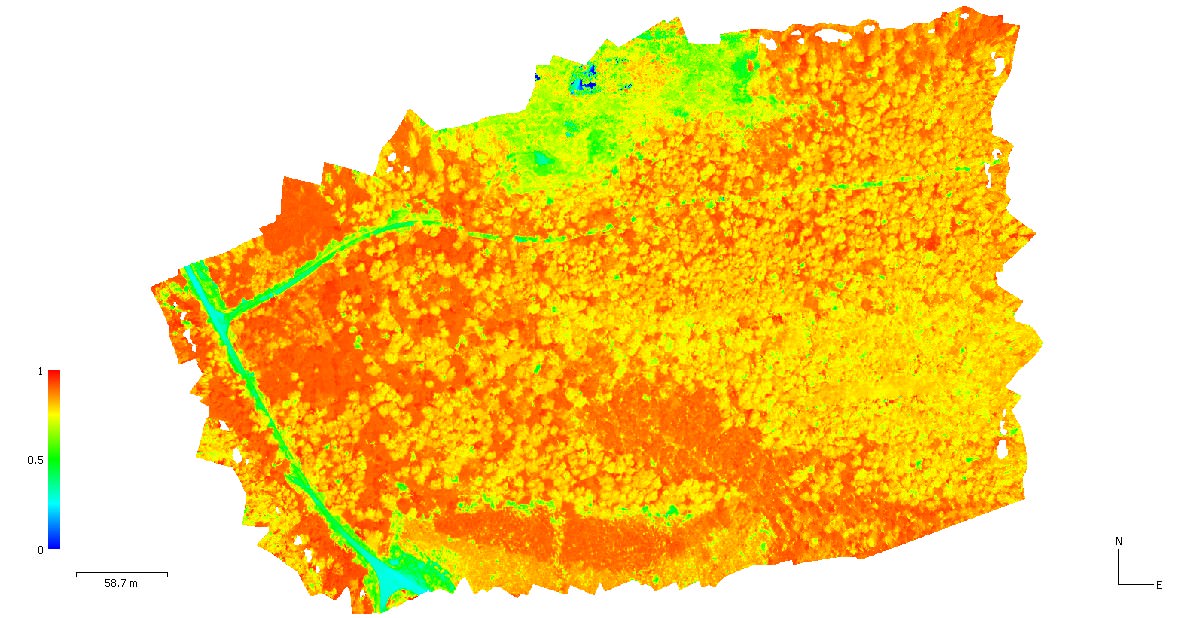
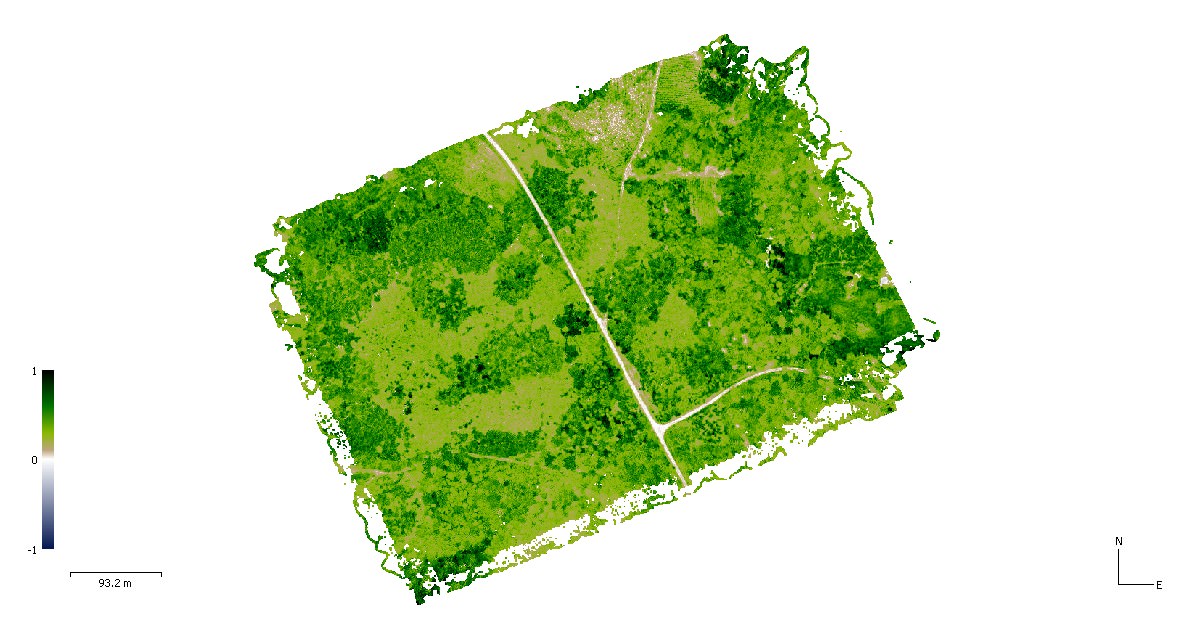
NDVI index (normalized differential vegetation index) – allows to determine the developmental state and condition of vegetation. The higher the index, the greater the amount of biomass. NDVI is based on the contrast between the greatest near infrared reflection and the red absorption. It is the basic tool used to assess the condition of the stand, to forecast when the tree will be fit for harvesting, and to locate areas of poorer condition.
The indicator takes values in the range from -1 to 1, which are represented in color on the map:
- Below 0.2 – areas without vegetation, e.g. exposed soil, dead organic matter, water, snow, buildings, etc.
- Between 0.2 and 0.4 – residual vegetation
- Between 0.4 and 0.7 – vegetation in good condition
- Above 0.7 – vegetation in very good condition. However, it should be remembered that the range of the indicator may be influenced by various factors (different type of cultivation, place of cultivation, etc.), therefore it is worth referring to the average values of the indicator for the entire field and historical data in order to properly assess the condition of the stand.